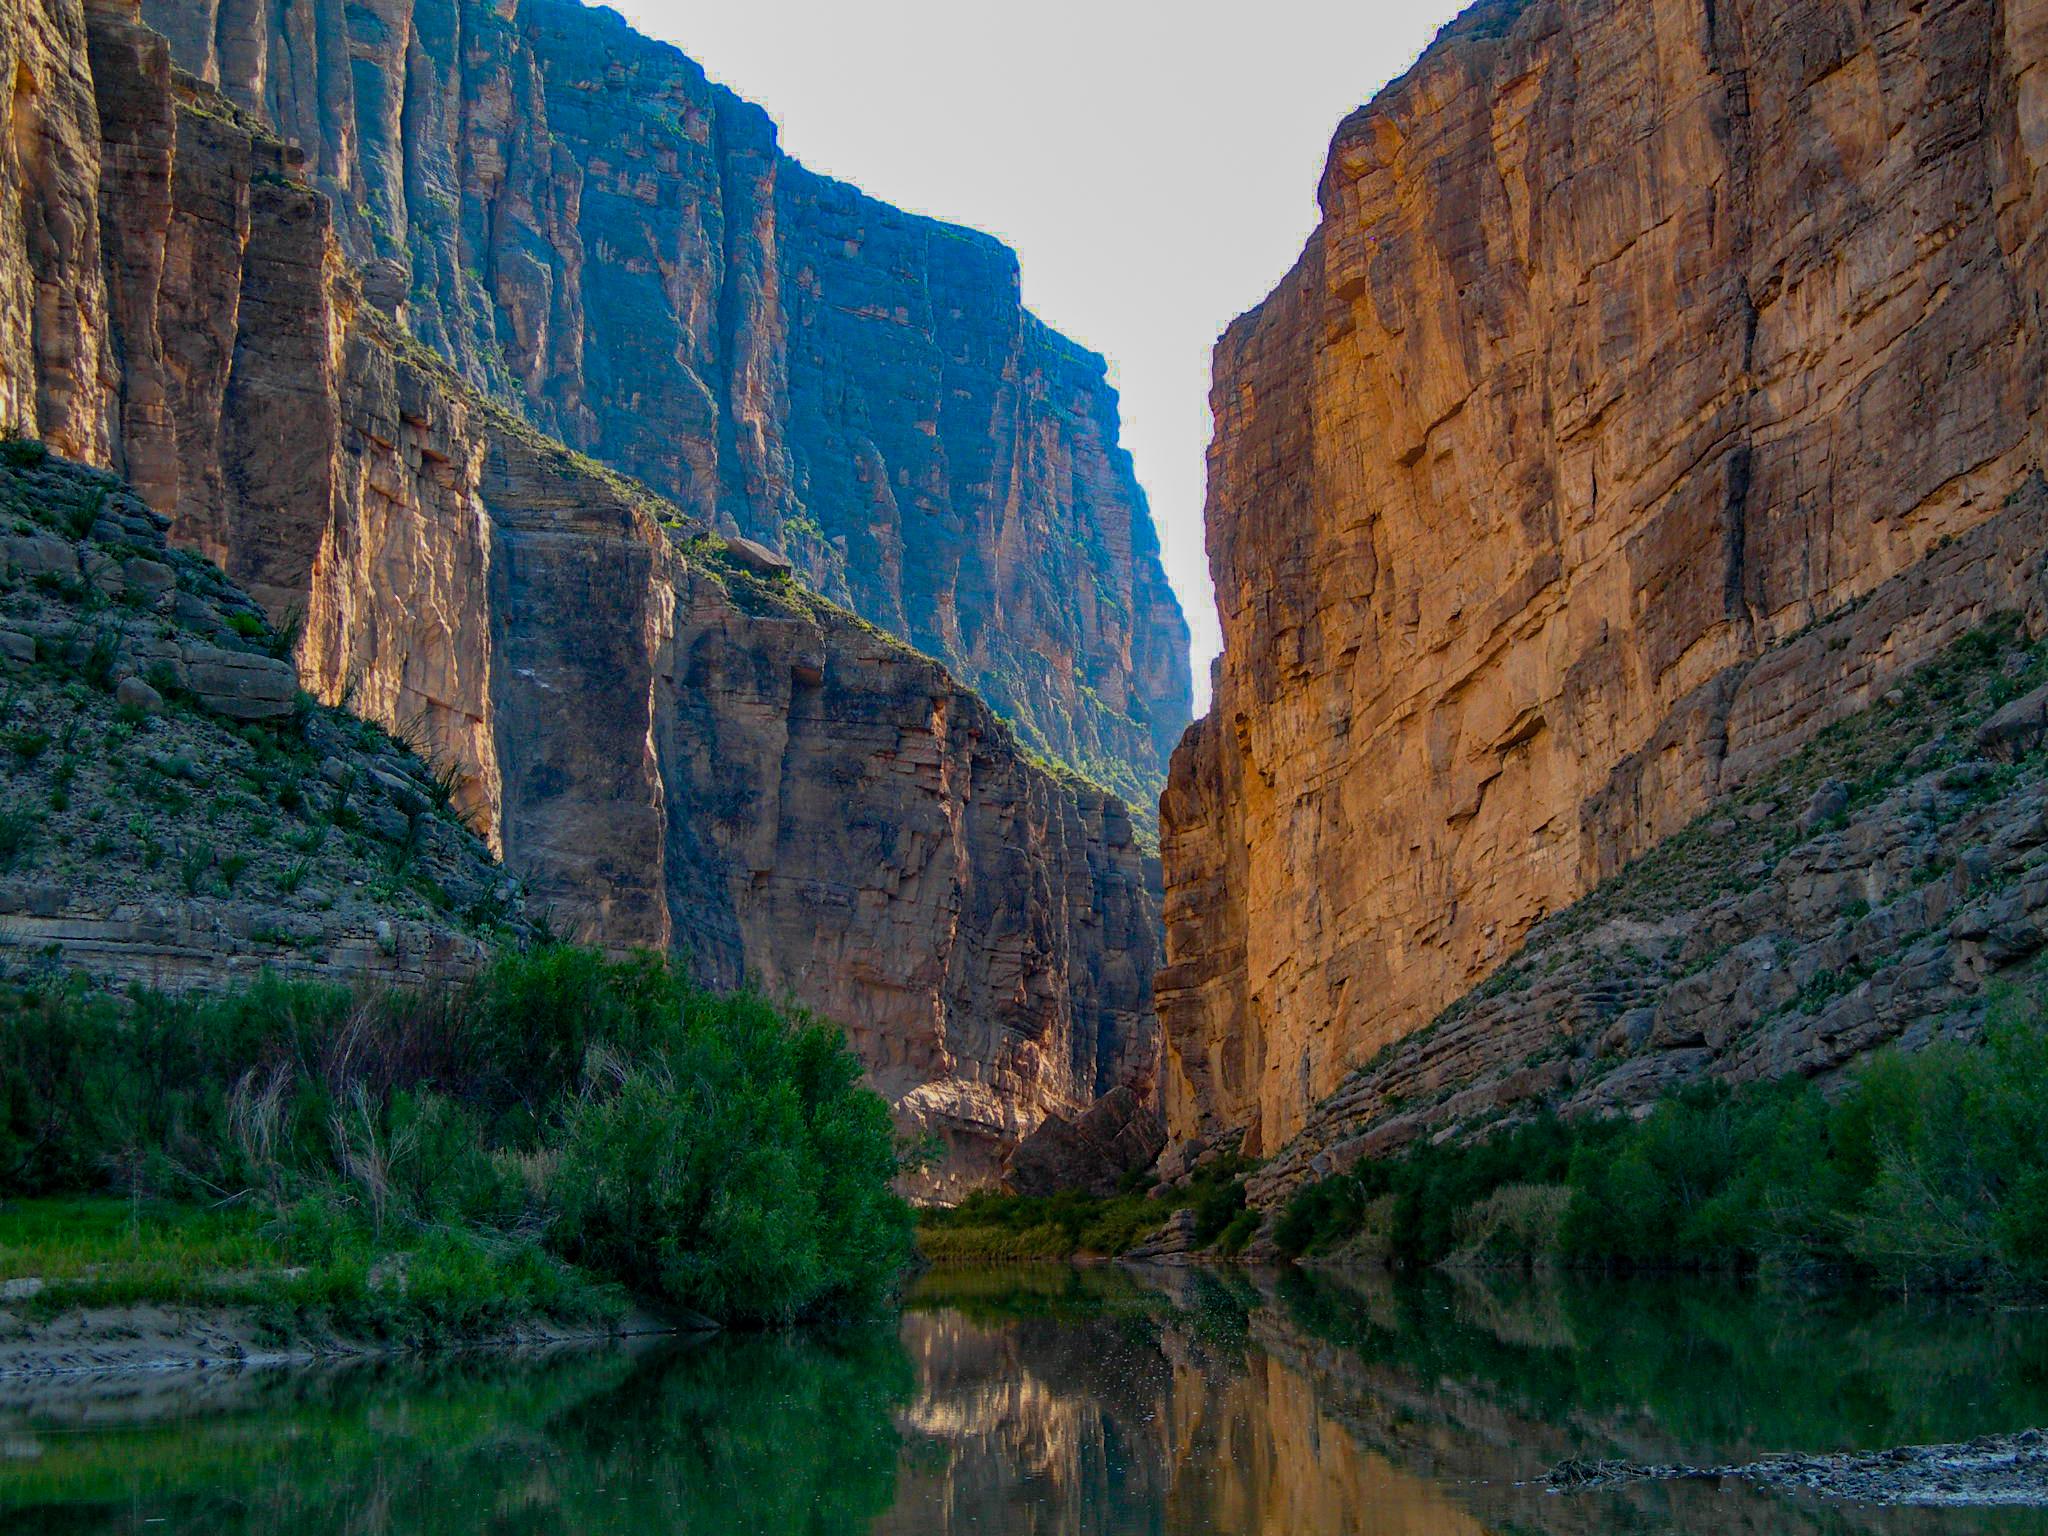
Best time to visit Big Bend National Park.
Photo · NPS / B. Trester · NPS sourceCheck before you go
- Closures, fire restrictions, construction and water: NPS Big Bend current conditions
- We are independent of the National Park Service. The official pages above are the source of record for anything that changes.
Compare Big Bend by month.
Compare monthly visit counts with the March peak, check average weather, and read the seasonal planning notes. Linked months have their own guide. Road access needs a separate check.
Weather · NOAA normals, PANTHER JUNCTION (3,740 ft)
| Month | Crowds | Weather | Roads & lodging | What it means |
|---|---|---|---|---|
| January |
Moderate
50% of March · 46K avg
|
Ideal
61°F / 37°F (16°C / 3°C)
|
Plan by route
Winter cold spells can change your plans; check the forecast.
|
Cool days and cold nights. Fewer average visits than March.Read the January guide |
| February |
Moderate
52% of March · 48K avg
|
Ideal
66°F / 41°F (19°C / 5°C)
|
Plan by route
Check your route separately from the station's monthly weather.
|
Our hiking compromise: warmer than January, with about half March's visits.Read the February guide |
| March |
Peak
100% of March · 93K avg
|
Ideal
74°F / 47°F (23°C / 8°C)
|
Plan by route
Arrange overnight stays before setting out.
|
The busiest month. Choose February for cooler days with fewer visits.Read the March guide |
| April |
Busy
71% of March · 66K avg
|
Ideal
82°F / 54°F (28°C / 12°C)
|
Plan by route
Check road conditions before choosing a desert drive.
|
Desert heat builds. February is a cooler choice for long walks.Read the April guide |
| May |
Moderate
46% of March · 43K avg
|
Mixed
89°F / 62°F (32°C / 17°C)
|
Plan by route
Heat can make outdoor recreation unsafe.
|
Summer heat begins. Do not treat lower visit counts as comfortable hiking weather.Read the May guide |
| June |
Quiet
26% of March · 25K avg
|
Rough
94°F / 68°F (34°C / 20°C)
|
Plan by route
A low visit count does not reduce the heat risk.
|
The hottest average month at Panther Junction. Keep heat central to your plans. |
| July |
Quiet
22% of March · 20K avg
|
Rough
92°F / 70°F (33°C / 21°C)
|
Plan by route
Locally heavy thunderstorms can cause flash flooding.
|
Hot days during the rainy season. Thunderstorms can bring flash flooding. |
| August |
Lowest
18% of March · 17K avg
|
Rough
91°F / 69°F (33°C / 21°C)
|
Plan by route
Locally heavy thunderstorms can cause flash flooding.
|
The fewest average visits, but persistent heat limits the appeal for hiking. |
| September |
Quiet
26% of March · 25K avg
|
Mixed
86°F / 63°F (30°C / 17°C)
|
Plan by route
Check conditions after rain, especially before backroad travel.
|
Still hot, with the rainy season continuing through September. |
| October |
Moderate
51% of March · 47K avg
|
Ideal
80°F / 55°F (27°C / 13°C)
|
Plan by route
River trips depend on river levels, not just the month.
|
Cooling from summer. November offers cooler average days.Read the October guide |
| November |
Busy
63% of March · 59K avg
|
Ideal
69°F / 45°F (21°C / 7°C)
|
Plan by route
Confirm overnight arrangements and check your route.
|
Cooler desert days return. Nights call for warm layers.Read the November guide |
| December |
Busy
63% of March · 58K avg
|
Ideal
62°F / 38°F (16°C / 3°C)
|
Plan by route
Prepare for winter cold spells, even when days are pleasant.
|
Cool days and cold nights. Prepare for changing winter weather.Read the December guide |
Open the full Big Bend crowd calendar
Rain, snow, latest-year counts, and the weather station
Panther Junction represents the headquarters area. The lower desert and Rio Grande are hotter; the Chisos Mountains are cooler. These station normals do not describe every district.
| Month | Visits in 2025 | Rain | Snow |
|---|---|---|---|
| Jan | 49,001 | 0.48″ | 0.1″ |
| Feb | 52,227 | 0.44″ | 0.1″ |
| Mar | 106,911 | 0.39″ | 0.0″ |
| Apr | 64,252 | 0.49″ | 0.0″ |
| May | 41,026 | 1.30″ | 0.0″ |
| Jun | 24,636 | 1.67″ | 0.0″ |
| Jul | 21,457 | 2.25″ | 0.0″ |
| Aug | 19,830 | 1.93″ | 0.0″ |
| Sep | 23,789 | 1.71″ | 0.0″ |
| Oct | 47,064 | 1.17″ | 0.0″ |
| Nov | 55,779 | 0.70″ | 0.0″ |
| Dec | 62,132 | 0.47″ | 0.2″ |
How these scores are computed (and why there's no combined "best month")
Crowd score
Formula: 100 − (this month's visits ÷ park's peak month visits) × 100. Each park scored against its own peak, not against other parks.
Source: NPS Visitor Use Statistics Data Package 2025, Recreation Visits (TRV), 5-year monthly mean (2021-2025). Reproduce these numbers on the NPS IRMA Stats portal.
Reading it: March at Big Bend reads 0 (peak). August reads 82 (quietest). A 50 means about half the park's peak crowd.
Weather score
Formula: weatherScore = round(max(0, min(100, dayComfort − precipPenalty − snowPenalty − freezePenalty))). The piecewise day-comfort function is continuous at every boundary.
- Day comfort:
tmax < 50°F →
max(10, (tmax − 20) × 2)(cold tail); 50–60°F →60 + (tmax − 50) × 4(ramp to 100); 60–78°F → 100 (plateau); 78–85°F →100 − (tmax − 78) × 5(ramp to 65); > 85°F →max(30, 65 − (tmax − 85) × 5)(hot tail). - Precip penalty:
max(0, prcpIn − 1.5) × 8; kicks in above 1.5 in / month. - Snow penalty:
snowIn × 2.5. If the selected station does not publish a snowfall normal, the score applies no snow penalty and labels snowfall as unavailable. - Night-freeze penalty:
max(0, 32 − tmin) × 1.5when tmin < 32°F.
Source: NOAA NCEI U.S. Climate Normals 1991-2020, station PANTHER JUNCTION, TX US (USC00416792, 3,740 ft).
Caveat: Panther Junction represents the headquarters area. The lower desert and Rio Grande are hotter; the Chisos Mountains are cooler. These station normals do not describe every district.
Road access
Road access is described in the route notes. We do not assign a percentage where the available evidence cannot support one. Seasonal patterns are not a guarantee that a road will be open on your trip.
Why no combined score?
A combined "best month" number forces a weighting: how much do you care about crowds vs. weather vs. access? Those weights are personal. A photographer optimizing for golden light weights differently than a parent locked to school break weights differently than a winter visitor with a 4WD. We show the inputs and let you decide. Use the per-month grid above to navigate to a deeper page.
When are roads and lodges open?
Roads, entrances, and lodges by season. Road closures and lodge seasons decide what a month can actually offer. Verify with NPS before you travel; these change.
Last updated · Oct 15, 2026
Book your overnight stay
Arrange accommodation or camping before arriving. Start with NPS places to stay and confirm availability directly.
Match the drive to your vehicle
Paved roads provide access to park highlights. Backroads need a separate vehicle and conditions check; use NPS backroad guidance before committing to one.
Plan river trips around river levels
A suitable month for hiking does not establish river-trip conditions. Check NPS river-trip guidance and discuss the route with your outfitter.
Questions about when to go.
What is the best month to visit Big Bend?
The best time to visit Big Bend National Park is November through March for cooler desert hiking. Confirm overnight arrangements and check official conditions before choosing a route.
When should I avoid Big Bend?
March has the highest average recreation visitation. For weather, the tougher month is June, when conditions limit how much you can comfortably do.
What are the quietest months at Big Bend?
The quietest stretch is August, July, and September. August is the low point, averaging about 16,691 recreation visits, roughly 18% of the March peak.
Which month has the best weather at Big Bend?
February is our hiking compromise, with an average high of 66°F (19°C) at Panther Junction and fewer visits than March. Choose it for cooler hiking; the best month for your trip also depends on your route and activities.
Is May a good time to visit Big Bend?
May begins the summer heat. Panther Junction's average high is 89°F (32°C), and the lower desert is hotter. For a trip centered on desert hiking, choose a cooler month such as February.
Does Big Bend get cold in winter?
Yes. January's average low at Panther Junction is 37°F (3°C), and winter cold spells can bring freezing weather. Bring warm layers and check the forecast; the mountains are cooler than the headquarters area.
When is Big Bend's rainy season?
The rainy season runs from July through September. Locally heavy thunderstorms can bring flash flooding, so check the forecast and official conditions before setting out.
How this page
is built.
Not affiliated with or endorsed
by the National Park Service.
Crowd numbers on this page are the Recreation Visits column from the NPS Visitor Use Statistics Data Package, 2025. Monthly figures are five-year arithmetic means (2021-2025) against each park's own peak month. We do not compare parks against each other for the crowd score: only against themselves.
Weather numbers are NOAA NCEI U.S. Climate Normals 1991-2020, drawn from the PANTHER JUNCTION, TX US station (USC00416792). The station sits at 3,740 ft; the station caveat explains how well these normals represent the places you plan to visit.
Access notes are an independent summary of NPS operating posture. We do not republish NPS pages; we link them. Conditions change; confirm road status, reservation requirements, and lodging windows on https://www.nps.gov/bibe/index.htm before travel.
Annual visit totals, records, and year-over-year changes: Big Bend visitation by year.
- Air quality: AirNow.gov; real-time air quality and smoke conditions.
- Park conditions: NPS Big Bend current conditions, verify before you drive.
The next Big Bend
window, in your inbox.
One email a month. The park to point at, the week to book, the trail that's about to fill up. Unsubscribe in a click.