Best time to visit Shenandoah

The best time to visit Shenandoah is April through October.

Selected months from the recommended season.

MeasureAprJunOur pick: SepOct
CrowdsQuietModerateModeratePeak
WeatherGoodGoodGoodGood
AccessFullFullFullFull
StaysLimitedLimitedLimitedLimited

Even though spring and fall can have fewer in-park stays in season, April through October offer milder weather for Skyline Drive and ridge walks. September is our pick because ridge temperatures are still mild and average visits are 52% less than the peak in October. October is the busier autumn-color alternative.

National Sites Guide

Share this page

Cite this page

Copy a citation

Visitors stand on a rocky outcrop overlooking the receding mountains.
Shenandoah mountain overlookNPS Photo / Neal Lewis
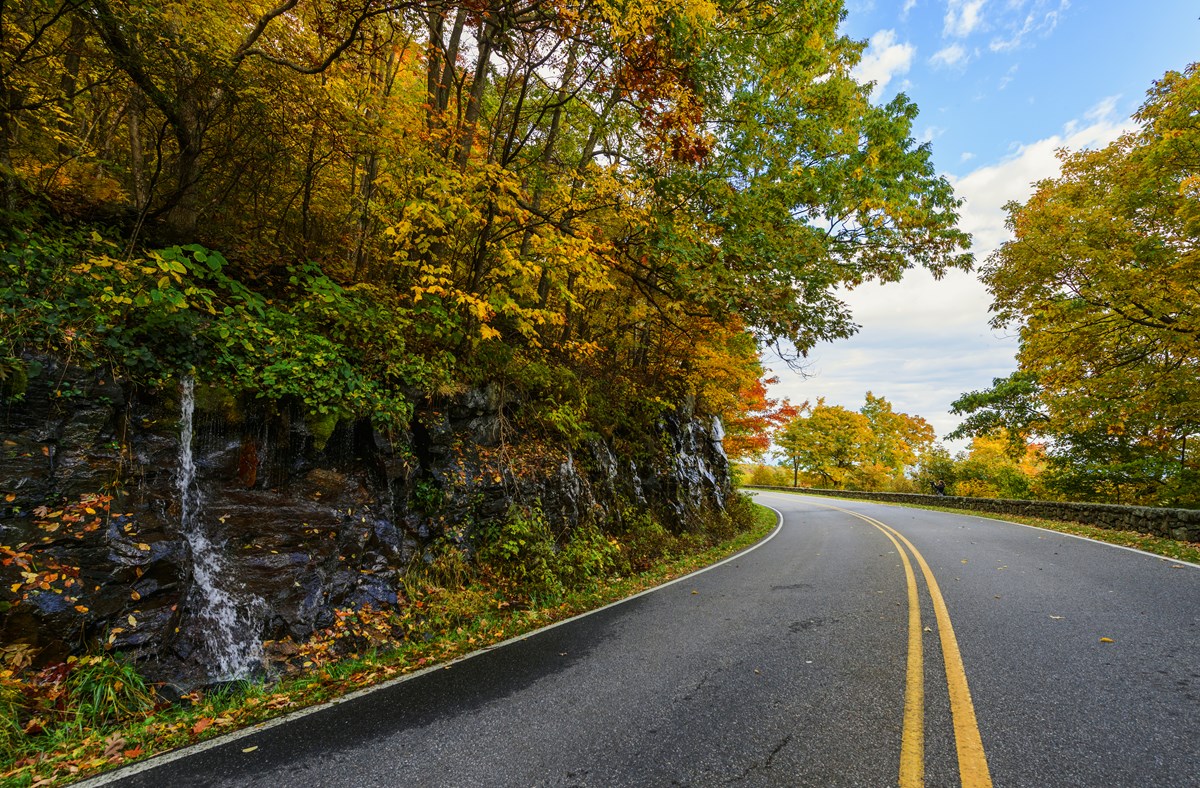
A road surrounded by fall foliage turns a curve around a small waterfall.
Skyline Drive in autumnNPS Photo / Neal Lewis
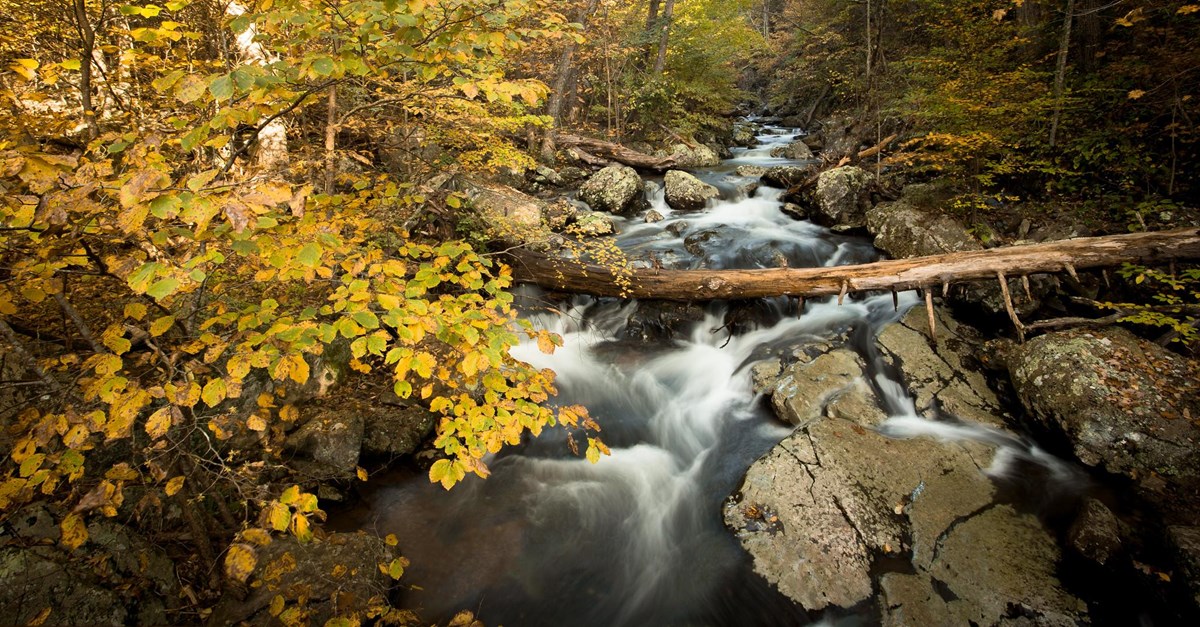
A river navigates through an autumn forest.
Whiteoak Canyon FallsNPS Photo / Brett Raeburn

Conditions

Last checked:

  • Emergency Phone Line Unavailable Safety · in effect now · nps.gov

Check before you go

  • Conditions

    NPS

    Check official road, trail and weather information for your destinations.

  • Getting around

    NPS

    Confirm the approach and any seasonal road or transport limits.

  • Overnight plans

    NPS

    Confirm your chosen stay dates, access and reservation directly.

Compare Shenandoah by month.

Compare Shenandoah visits, station weather, road approaches and overnight seasons for all twelve months. Read the scope before comparing Access and Stays. Operating seasons are not vacancies.

Month Crowds Weather AccessStays What it means
January Lowest 8% of October · 24K avg Harsh 36°F / 19°F (2°C / -7°C) Limitedaccess Limitedlodging The lowest average visits, with cold ridge weather and possible road closures.Read the January guide

January crowds

24,259 average January visits in 2021–2025.

Monthly recreation visits

47 annual records · 1979–2025

January recreation visits, 1979 to 2025NPS park-wide recreation visits for January in each year. The vertical scale starts at zero. Exact counts follow in the data table. Missing counts are gaps.025k50k1979: 24,503 visits1980: 22,968 visits1981: 29,335 visits1982: 13,409 visits1983: 27,280 visits1984: 23,538 visits1985: 17,864 visits1986: 32,930 visits1987: 26,762 visits1988: 32,624 visits1989: 42,897 visits1990: 33,856 visits1991: 31,529 visits1992: 32,946 visits1993: 38,942 visits1994: 13,792 visits1995: 26,693 visits1996: 11,109 visits1997: 21,177 visits1998: 22,879 visits1999: 13,782 visits2000: 24,257 visits2001: 16,916 visits2002: 26,668 visits2003: 14,899 visits2004: 14,864 visits2005: 16,573 visits2006: 16,328 visits2007: 13,113 visits2008: 15,983 visits2009: 15,414 visits2010: 3,576 visits2011: 13,019 visits2012: 18,017 visits2013: 13,786 visits2014: 8,052 visits2015: 11,278 visits2016: 16,626 visits2017: 19,961 visits2018: 23,798 visits2019: 20,245 visits2020: 27,236 visits2021: 37,588 visits2022: 13,592 visits2023: 33,275 visits2024: 24,853 visits2025: 11,989 visits197919891999200920192025

Scroll the chart to see all years →

Hover, focus or tap a bar to see its year and value.

NPS recreation visits are visits, not unique visitors or a measure of how busy an individual trail feels. Counts can reflect closures, disruptions and changes in counting methods.

January weather

1991 through 2020 averages

Average high
36°F / 2°C
Average low
19°F / -7°C
Monthly precipitation
2.85 in / 72 mm

Big Meadows at about 3,540 ft supplies the ridge temperature normals. The rain normals shown in the table come from Luray 5 E at about 1,400 ft on the valley floor, not the ridge. Snowfall normals are not reported. The historical charts use Big Meadows observations and preserve missing rain data; they do not substitute Luray normals for observations.

January weather through the years at Big Meadows, VA.

Average daily high and low (°F)

38 complete high-temperature records · 37 complete low-temperature records

■ High■ Low

January: Average daily high and low (°F), 1935–2025Only complete calendar months are plotted. Gaps indicate missing or flagged daily observations. Exact values follow in the table.02550January 1937: average high 44.68 °FJanuary 1940: average high 23.18 °FJanuary 1941: average high 39.11 °FJanuary 1943: average high 40.15 °FJanuary 1945: average high 33.60 °FJanuary 1953: average high 43.22 °FJanuary 1954: average high 40.00 °FJanuary 1959: average high 37.42 °FJanuary 1960: average high 38.56 °FJanuary 1961: average high 30.49 °FJanuary 1962: average high 37.52 °FJanuary 1963: average high 34.30 °FJanuary 1964: average high 38.22 °FJanuary 1965: average high 36.51 °FJanuary 1966: average high 30.90 °FJanuary 1967: average high 40.88 °FJanuary 1968: average high 34.49 °FJanuary 1970: average high 29.49 °FJanuary 1971: average high 32.23 °FJanuary 1972: average high 39.44 °FJanuary 1973: average high 36.33 °FJanuary 1974: average high 44.40 °FJanuary 1975: average high 40.29 °FJanuary 1976: average high 33.49 °FJanuary 1977: average high 24.00 °FJanuary 1978: average high 27.86 °FJanuary 1979: average high 33.35 °FJanuary 1980: average high 34.36 °FJanuary 1981: average high 27.99 °FJanuary 1982: average high 29.61 °FJanuary 1984: average high 32.44 °FJanuary 1985: average high 29.01 °FJanuary 1986: average high 35.94 °FJanuary 1987: average high 33.25 °FJanuary 1988: average high 31.93 °FJanuary 1991: average high 38.17 °FJanuary 1995: average high 35.33 °FJanuary 1998: average high 38.14 °FJanuary 1935: average low 12.23 °FJanuary 1937: average low 28.57 °FJanuary 1940: average low 7.74 °FJanuary 1941: average low 17.86 °FJanuary 1943: average low 22.91 °FJanuary 1945: average low 16.25 °FJanuary 1946: average low 19.92 °FJanuary 1947: average low 25.93 °FJanuary 1948: average low 11.40 °FJanuary 1949: average low 26.55 °FJanuary 1953: average low 25.43 °FJanuary 1956: average low 17.65 °FJanuary 1957: average low 18.00 °FJanuary 1958: average low 17.19 °FJanuary 1959: average low 17.72 °FJanuary 1961: average low 14.92 °FJanuary 1962: average low 18.70 °FJanuary 1963: average low 15.07 °FJanuary 1964: average low 20.13 °FJanuary 1965: average low 17.55 °FJanuary 1966: average low 14.72 °FJanuary 1967: average low 24.40 °FJanuary 1968: average low 16.56 °FJanuary 1970: average low 12.50 °FJanuary 1971: average low 14.73 °FJanuary 1973: average low 19.28 °FJanuary 1974: average low 27.68 °FJanuary 1976: average low 13.36 °FJanuary 1977: average low 5.91 °FJanuary 1979: average low 14.61 °FJanuary 1980: average low 18.37 °FJanuary 1981: average low 10.01 °FJanuary 1982: average low 8.94 °FJanuary 1984: average low 16.17 °FJanuary 1985: average low 12.18 °FJanuary 1986: average low 16.07 °FJanuary 1988: average low 9.91 °F193519802025

Scroll the chart to see all years →

Hover, focus or tap a bar to see its year and value.

Monthly precipitation (inches)

26 complete rain records

January: Monthly precipitation (inches), 1935–2025Only complete calendar months are plotted. Gaps indicate missing or flagged daily observations. Exact values follow in the table.0510January 1949: precipitation 4.74 inJanuary 1950: precipitation 2.57 inJanuary 1951: precipitation 2.62 inJanuary 1953: precipitation 3.89 inJanuary 1954: precipitation 3.54 inJanuary 1955: precipitation 0.38 inJanuary 1957: precipitation 2.98 inJanuary 1958: precipitation 4.52 inJanuary 1959: precipitation 2.33 inJanuary 1961: precipitation 2.87 inJanuary 1962: precipitation 2.33 inJanuary 1963: precipitation 1.43 inJanuary 1964: precipitation 4.96 inJanuary 1965: precipitation 3.12 inJanuary 1966: precipitation 4.13 inJanuary 1967: precipitation 1.76 inJanuary 1968: precipitation 4.25 inJanuary 1969: precipitation 3.90 inJanuary 1970: precipitation 1.59 inJanuary 1971: precipitation 3.49 inJanuary 1972: precipitation 1.88 inJanuary 1973: precipitation 3.77 inJanuary 1974: precipitation 4.02 inJanuary 1975: precipitation 3.28 inJanuary 1976: precipitation 4.63 inJanuary 1978: precipitation 9.93 in193519802025

Scroll the chart to see all years →

Hover, focus or tap a bar to see its year and value.

Big Meadows, VA station observations, not a park-wide average or forecast. Complete quality-screened calendar months only, separately by metric. Daily high/low means and total precipitation; incomplete months stay null. No interpolation or substitution. Completed years only; separate from 1991-2020 normals.

January access

Typical access through the listed entrances or visitor areas. Check official guidance before you travel.

Approaches and visitor areas Skyline Drive has four vehicle entrances. The road operates year-round, weather permitting, but snow and ice can interrupt travel. Pick an entrance near your planned part of the ridge. Lettered points are the reviewed entrance or access-area locations. They do not mark every road, trail or gate. Front Royal Entrance (North Entrance)A Thornton Gap EntranceB Swift Run Gap EntranceC Rockfish Gap Entrance (South Entrance)DN
  • Park boundary
  • AFront Royal Entrance (North Entrance)
    Open

    Normal road approach, subject to weather and individual site restrictions. This marker is an access location, not a guarantee that every facility is operating.

  • BThornton Gap Entrance
    Open

    Normal road approach, subject to weather and individual site restrictions. This marker is an access location, not a guarantee that every facility is operating.

  • CSwift Run Gap Entrance
    Open

    Normal road approach, subject to weather and individual site restrictions. This marker is an access location, not a guarantee that every facility is operating.

  • DRockfish Gap Entrance (South Entrance)
    Open

    Normal road approach, subject to weather and individual site restrictions. This marker is an access location, not a guarantee that every facility is operating.

January in-park stays

three concessioner lodge/cabin properties, four family campgrounds, Dundo group camping and the separately identified PATC primitive cabins. Normal seasons are planning guidance, not vacancies. Opening/closing months are partial. Unverified means confirm directly. These are normal seasonal schedules, not room or campsite availability.

Frontcountry campground

  • 1Mathews Arm
    Closed

    Outside the normal operating season. Check the published calendar for your dates.

  • 2Big Meadows
    Closed

    Outside the normal operating season. Check the published calendar for your dates.

  • 3Lewis Mountain
    Closed

    Outside the normal operating season. Check the published calendar for your dates.

  • 4Loft Mountain
    Closed

    Outside the normal operating season. Check the published calendar for your dates.

Lodge/cabins

  • Skyland
    Closed

    Outside the normal operating season. Check the published calendar for your dates.

  • Big Meadows Lodge
    Closed

    Outside the normal operating season. Check the published calendar for your dates.

  • Lewis Mountain Cabins
    Closed

    Outside the normal operating season. Check the published calendar for your dates.

Separate campground area, confirm use and operating calendar

  • Dundo campground area
    Unverified

    A dependable full-month operating season is not established here. Confirm dates directly before booking.

Supplemental hike-in cabins, separate from road lodging

  • PATC primitive cabins
    Unverified

    A dependable full-month operating season is not established here. Confirm dates directly before booking.

Backcountry trips, permits and specialist travel need separate planning and are outside the frontcountry comparison.

February Lowest 9% of October · 28K avg Harsh 38°F / 22°F (3°C / -6°C) Limitedaccess Limitedlodging Winter road and trail conditions. Standard seasonal stays are outside their season.Read the February guide

February crowds

27,667 average February visits in 2021–2025.

Monthly recreation visits

47 annual records · 1979–2025

February recreation visits, 1979 to 2025NPS park-wide recreation visits for February in each year. The vertical scale starts at zero. Exact counts follow in the data table. Missing counts are gaps.050k100k1979: 20,437 visits1980: 22,352 visits1981: 36,964 visits1982: 17,181 visits1983: 22,633 visits1984: 41,150 visits1985: 30,458 visits1986: 20,997 visits1987: 29,916 visits1988: 29,494 visits1989: 32,313 visits1990: 42,354 visits1991: 51,095 visits1992: 39,282 visits1993: 25,330 visits1994: 25,220 visits1995: 31,145 visits1996: 24,167 visits1997: 38,070 visits1998: 12,937 visits1999: 31,557 visits2000: 31,041 visits2001: 27,839 visits2002: 32,594 visits2003: 5,115 visits2004: 23,956 visits2005: 18,263 visits2006: 14,081 visits2007: 9,149 visits2008: 14,836 visits2009: 20,070 visits2010: 1,144 visits2011: 18,224 visits2012: 15,954 visits2013: 9,620 visits2014: 10,115 visits2015: 9,610 visits2016: 20,687 visits2017: 43,927 visits2018: 19,335 visits2019: 10,264 visits2020: 35,473 visits2021: 9,991 visits2022: 34,383 visits2023: 38,840 visits2024: 40,505 visits2025: 14,614 visits197919891999200920192025

Scroll the chart to see all years →

Hover, focus or tap a bar to see its year and value.

NPS recreation visits are visits, not unique visitors or a measure of how busy an individual trail feels. Counts can reflect closures, disruptions and changes in counting methods.

February weather

1991 through 2020 averages

Average high
38°F / 3°C
Average low
22°F / -6°C
Monthly precipitation
2.45 in / 62 mm

Big Meadows at about 3,540 ft supplies the ridge temperature normals. The rain normals shown in the table come from Luray 5 E at about 1,400 ft on the valley floor, not the ridge. Snowfall normals are not reported. The historical charts use Big Meadows observations and preserve missing rain data; they do not substitute Luray normals for observations.

February weather through the years at Big Meadows, VA.

Average daily high and low (°F)

45 complete high-temperature records · 34 complete low-temperature records

■ High■ Low

February: Average daily high and low (°F), 1935–2025Only complete calendar months are plotted. Gaps indicate missing or flagged daily observations. Exact values follow in the table.02550February 1936: average high 34.14 °FFebruary 1937: average high 37.00 °FFebruary 1939: average high 44.12 °FFebruary 1942: average high 37.22 °FFebruary 1943: average high 40.59 °FFebruary 1946: average high 41.71 °FFebruary 1949: average high 46.77 °FFebruary 1950: average high 40.47 °FFebruary 1951: average high 43.56 °FFebruary 1953: average high 42.22 °FFebruary 1954: average high 44.21 °FFebruary 1956: average high 42.68 °FFebruary 1960: average high 36.03 °FFebruary 1961: average high 41.32 °FFebruary 1962: average high 40.99 °FFebruary 1963: average high 33.59 °FFebruary 1964: average high 33.28 °FFebruary 1965: average high 39.75 °FFebruary 1966: average high 35.78 °FFebruary 1968: average high 30.25 °FFebruary 1969: average high 30.28 °FFebruary 1971: average high 37.27 °FFebruary 1972: average high 35.90 °FFebruary 1973: average high 35.47 °FFebruary 1974: average high 37.93 °FFebruary 1975: average high 40.10 °FFebruary 1976: average high 45.38 °FFebruary 1977: average high 36.89 °FFebruary 1978: average high 27.22 °FFebruary 1979: average high 29.99 °FFebruary 1980: average high 29.89 °FFebruary 1981: average high 38.63 °FFebruary 1982: average high 38.35 °FFebruary 1983: average high 37.11 °FFebruary 1984: average high 41.34 °FFebruary 1985: average high 36.50 °FFebruary 1986: average high 38.15 °FFebruary 1987: average high 37.14 °FFebruary 1988: average high 37.70 °FFebruary 1990: average high 47.35 °FFebruary 1991: average high 43.20 °FFebruary 1992: average high 40.35 °FFebruary 1993: average high 35.54 °FFebruary 1995: average high 33.54 °FFebruary 1997: average high 40.81 °FFebruary 1937: average low 19.09 °FFebruary 1939: average low 23.29 °FFebruary 1941: average low 14.57 °FFebruary 1942: average low 15.40 °FFebruary 1943: average low 20.63 °FFebruary 1947: average low 10.28 °FFebruary 1948: average low 20.86 °FFebruary 1949: average low 25.20 °FFebruary 1950: average low 20.99 °FFebruary 1953: average low 24.23 °FFebruary 1954: average low 25.89 °FFebruary 1959: average low 21.82 °FFebruary 1960: average low 18.99 °FFebruary 1961: average low 25.43 °FFebruary 1962: average low 21.00 °FFebruary 1963: average low 11.42 °FFebruary 1964: average low 17.12 °FFebruary 1965: average low 19.19 °FFebruary 1966: average low 20.22 °FFebruary 1968: average low 13.24 °FFebruary 1969: average low 18.45 °FFebruary 1970: average low 18.58 °FFebruary 1971: average low 19.93 °FFebruary 1972: average low 17.70 °FFebruary 1974: average low 18.33 °FFebruary 1975: average low 22.98 °FFebruary 1976: average low 24.59 °FFebruary 1977: average low 18.20 °FFebruary 1978: average low 9.96 °FFebruary 1981: average low 18.80 °FFebruary 1984: average low 24.96 °FFebruary 1987: average low 16.35 °FFebruary 1990: average low 24.64 °FFebruary 1992: average low 21.68 °F193519802025

Scroll the chart to see all years →

Hover, focus or tap a bar to see its year and value.

Monthly precipitation (inches)

30 complete rain records

February: Monthly precipitation (inches), 1935–2025Only complete calendar months are plotted. Gaps indicate missing or flagged daily observations. Exact values follow in the table.03.57February 1949: precipitation 2.48 inFebruary 1950: precipitation 2.28 inFebruary 1951: precipitation 3.35 inFebruary 1952: precipitation 3.56 inFebruary 1953: precipitation 2.04 inFebruary 1954: precipitation 1.73 inFebruary 1955: precipitation 2.93 inFebruary 1956: precipitation 2.97 inFebruary 1957: precipitation 5.15 inFebruary 1958: precipitation 4.22 inFebruary 1959: precipitation 1.45 inFebruary 1962: precipitation 3.22 inFebruary 1963: precipitation 2.00 inFebruary 1964: precipitation 4.78 inFebruary 1965: precipitation 4.58 inFebruary 1966: precipitation 2.96 inFebruary 1967: precipitation 1.72 inFebruary 1968: precipitation 0.68 inFebruary 1969: precipitation 1.03 inFebruary 1970: precipitation 3.56 inFebruary 1971: precipitation 4.96 inFebruary 1972: precipitation 6.76 inFebruary 1973: precipitation 3.39 inFebruary 1974: precipitation 1.28 inFebruary 1975: precipitation 2.94 inFebruary 1976: precipitation 1.43 inFebruary 1977: precipitation 0.86 inFebruary 1978: precipitation 0.52 inFebruary 1979: precipitation 4.82 inFebruary 1981: precipitation 6.70 in193519802025

Scroll the chart to see all years →

Hover, focus or tap a bar to see its year and value.

Big Meadows, VA station observations, not a park-wide average or forecast. Complete quality-screened calendar months only, separately by metric. Daily high/low means and total precipitation; incomplete months stay null. No interpolation or substitution. Completed years only; separate from 1991-2020 normals.

February access

Typical access through the listed entrances or visitor areas. Check official guidance before you travel.

Approaches and visitor areas Skyline Drive has four vehicle entrances. The road operates year-round, weather permitting, but snow and ice can interrupt travel. Pick an entrance near your planned part of the ridge. Lettered points are the reviewed entrance or access-area locations. They do not mark every road, trail or gate. Front Royal Entrance (North Entrance)A Thornton Gap EntranceB Swift Run Gap EntranceC Rockfish Gap Entrance (South Entrance)DN
  • Park boundary
  • AFront Royal Entrance (North Entrance)
    Open

    Normal road approach, subject to weather and individual site restrictions. This marker is an access location, not a guarantee that every facility is operating.

  • BThornton Gap Entrance
    Open

    Normal road approach, subject to weather and individual site restrictions. This marker is an access location, not a guarantee that every facility is operating.

  • CSwift Run Gap Entrance
    Open

    Normal road approach, subject to weather and individual site restrictions. This marker is an access location, not a guarantee that every facility is operating.

  • DRockfish Gap Entrance (South Entrance)
    Open

    Normal road approach, subject to weather and individual site restrictions. This marker is an access location, not a guarantee that every facility is operating.

February in-park stays

three concessioner lodge/cabin properties, four family campgrounds, Dundo group camping and the separately identified PATC primitive cabins. Normal seasons are planning guidance, not vacancies. Opening/closing months are partial. Unverified means confirm directly. These are normal seasonal schedules, not room or campsite availability.

Frontcountry campground

  • 1Mathews Arm
    Closed

    Outside the normal operating season. Check the published calendar for your dates.

  • 2Big Meadows
    Closed

    Outside the normal operating season. Check the published calendar for your dates.

  • 3Lewis Mountain
    Closed

    Outside the normal operating season. Check the published calendar for your dates.

  • 4Loft Mountain
    Closed

    Outside the normal operating season. Check the published calendar for your dates.

Lodge/cabins

  • Skyland
    Closed

    Outside the normal operating season. Check the published calendar for your dates.

  • Big Meadows Lodge
    Closed

    Outside the normal operating season. Check the published calendar for your dates.

  • Lewis Mountain Cabins
    Closed

    Outside the normal operating season. Check the published calendar for your dates.

Separate campground area, confirm use and operating calendar

  • Dundo campground area
    Unverified

    A dependable full-month operating season is not established here. Confirm dates directly before booking.

Supplemental hike-in cabins, separate from road lodging

  • PATC primitive cabins
    Unverified

    A dependable full-month operating season is not established here. Confirm dates directly before booking.

Backcountry trips, permits and specialist travel need separate planning and are outside the frontcountry comparison.

March Quiet 23% of October · 75K avg Rough 44°F / 27°F (6°C / -3°C) Limitedaccess Limitedlodging Cold ridge nights. Some campgrounds and Skyland normally open during the month.Read the March guide

March crowds

74,558 average March visits in 2021–2025.

Monthly recreation visits

47 annual records · 1979–2025

March recreation visits, 1979 to 2025NPS park-wide recreation visits for March in each year. The vertical scale starts at zero. Exact counts follow in the data table. Missing counts are gaps.075k150k1979: 67,572 visits1980: 49,132 visits1981: 61,981 visits1982: 49,035 visits1983: 60,503 visits1984: 60,783 visits1985: 73,541 visits1986: 79,527 visits1987: 64,499 visits1988: 65,011 visits1989: 80,035 visits1990: 73,022 visits1991: 86,509 visits1992: 66,805 visits1993: 41,559 visits1994: 61,505 visits1995: 79,367 visits1996: 65,262 visits1997: 73,063 visits1998: 27,762 visits1999: 41,025 visits2000: 58,479 visits2001: 41,798 visits2002: 56,411 visits2003: 42,356 visits2004: 41,044 visits2005: 33,382 visits2006: 39,156 visits2007: 33,699 visits2008: 43,857 visits2009: 30,970 visits2010: 33,230 visits2011: 36,600 visits2012: 46,454 visits2013: 30,481 visits2014: 29,951 visits2015: 33,194 visits2016: 56,390 visits2017: 44,352 visits2018: 46,587 visits2019: 38,601 visits2020: 133,333 visits2021: 76,682 visits2022: 56,623 visits2023: 53,571 visits2024: 93,287 visits2025: 92,625 visits197919891999200920192025

Scroll the chart to see all years →

Hover, focus or tap a bar to see its year and value.

NPS recreation visits are visits, not unique visitors or a measure of how busy an individual trail feels. Counts can reflect closures, disruptions and changes in counting methods.

March weather

1991 through 2020 averages

Average high
44°F / 6°C
Average low
27°F / -3°C
Monthly precipitation
3.58 in / 91 mm

Big Meadows at about 3,540 ft supplies the ridge temperature normals. The rain normals shown in the table come from Luray 5 E at about 1,400 ft on the valley floor, not the ridge. Snowfall normals are not reported. The historical charts use Big Meadows observations and preserve missing rain data; they do not substitute Luray normals for observations.

March weather through the years at Big Meadows, VA.

Average daily high and low (°F)

37 complete high-temperature records · 37 complete low-temperature records

■ High■ Low

March: Average daily high and low (°F), 1935–2025Only complete calendar months are plotted. Gaps indicate missing or flagged daily observations. Exact values follow in the table.03060March 1937: average high 41.56 °FMarch 1941: average high 44.79 °FMarch 1944: average high 46.10 °FMarch 1947: average high 38.27 °FMarch 1951: average high 44.73 °FMarch 1954: average high 47.82 °FMarch 1956: average high 45.99 °FMarch 1957: average high 44.59 °FMarch 1958: average high 36.70 °FMarch 1959: average high 47.29 °FMarch 1960: average high 30.93 °FMarch 1961: average high 49.71 °FMarch 1962: average high 40.03 °FMarch 1963: average high 50.57 °FMarch 1964: average high 46.28 °FMarch 1965: average high 41.23 °FMarch 1967: average high 46.90 °FMarch 1968: average high 50.59 °FMarch 1971: average high 40.23 °FMarch 1972: average high 45.37 °FMarch 1973: average high 50.32 °FMarch 1974: average high 48.84 °FMarch 1975: average high 41.59 °FMarch 1977: average high 51.98 °FMarch 1978: average high 41.29 °FMarch 1979: average high 47.25 °FMarch 1980: average high 40.53 °FMarch 1981: average high 40.80 °FMarch 1982: average high 46.00 °FMarch 1983: average high 44.47 °FMarch 1984: average high 38.97 °FMarch 1985: average high 49.22 °FMarch 1986: average high 48.13 °FMarch 1987: average high 45.91 °FMarch 1988: average high 47.03 °FMarch 1990: average high 50.13 °FMarch 1995: average high 48.06 °FMarch 1937: average low 24.38 °FMarch 1941: average low 18.54 °FMarch 1944: average low 24.83 °FMarch 1945: average low 36.56 °FMarch 1947: average low 17.73 °FMarch 1948: average low 28.87 °FMarch 1951: average low 26.55 °FMarch 1954: average low 26.63 °FMarch 1956: average low 24.89 °FMarch 1957: average low 26.61 °FMarch 1958: average low 23.38 °FMarch 1959: average low 25.85 °FMarch 1960: average low 14.77 °FMarch 1961: average low 30.03 °FMarch 1962: average low 24.05 °FMarch 1963: average low 30.84 °FMarch 1964: average low 27.58 °FMarch 1965: average low 22.40 °FMarch 1966: average low 28.04 °FMarch 1967: average low 26.90 °FMarch 1968: average low 28.74 °FMarch 1969: average low 21.51 °FMarch 1970: average low 23.27 °FMarch 1971: average low 22.81 °FMarch 1972: average low 25.28 °FMarch 1973: average low 34.47 °FMarch 1974: average low 29.03 °FMarch 1977: average low 31.42 °FMarch 1979: average low 29.60 °FMarch 1980: average low 22.67 °FMarch 1981: average low 21.64 °FMarch 1982: average low 25.68 °FMarch 1983: average low 28.06 °FMarch 1986: average low 26.12 °FMarch 1987: average low 24.67 °FMarch 1988: average low 23.62 °FMarch 1995: average low 30.07 °F193519802025

Scroll the chart to see all years →

Hover, focus or tap a bar to see its year and value.

Monthly precipitation (inches)

30 complete rain records

March: Monthly precipitation (inches), 1935–2025Only complete calendar months are plotted. Gaps indicate missing or flagged daily observations. Exact values follow in the table.0510March 1951: precipitation 6.10 inMarch 1952: precipitation 5.06 inMarch 1953: precipitation 7.63 inMarch 1954: precipitation 7.03 inMarch 1955: precipitation 4.33 inMarch 1956: precipitation 3.34 inMarch 1957: precipitation 1.44 inMarch 1958: precipitation 6.31 inMarch 1959: precipitation 3.09 inMarch 1961: precipitation 3.62 inMarch 1963: precipitation 6.75 inMarch 1964: precipitation 2.58 inMarch 1965: precipitation 4.35 inMarch 1966: precipitation 2.51 inMarch 1967: precipitation 5.13 inMarch 1968: precipitation 4.69 inMarch 1969: precipitation 3.06 inMarch 1970: precipitation 2.88 inMarch 1971: precipitation 1.95 inMarch 1972: precipitation 2.18 inMarch 1973: precipitation 4.88 inMarch 1974: precipitation 2.83 inMarch 1975: precipitation 9.09 inMarch 1976: precipitation 1.96 inMarch 1977: precipitation 3.61 inMarch 1978: precipitation 3.54 inMarch 1979: precipitation 4.07 inMarch 1980: precipitation 4.49 inMarch 1981: precipitation 1.06 inMarch 1984: precipitation 8.06 in193519802025

Scroll the chart to see all years →

Hover, focus or tap a bar to see its year and value.

Big Meadows, VA station observations, not a park-wide average or forecast. Complete quality-screened calendar months only, separately by metric. Daily high/low means and total precipitation; incomplete months stay null. No interpolation or substitution. Completed years only; separate from 1991-2020 normals.

March access

Typical access through the listed entrances or visitor areas. Check official guidance before you travel.

Approaches and visitor areas Skyline Drive has four vehicle entrances. The road operates year-round, weather permitting, but snow and ice can interrupt travel. Pick an entrance near your planned part of the ridge. Lettered points are the reviewed entrance or access-area locations. They do not mark every road, trail or gate. Front Royal Entrance (North Entrance)A Thornton Gap EntranceB Swift Run Gap EntranceC Rockfish Gap Entrance (South Entrance)DN
  • Park boundary
  • AFront Royal Entrance (North Entrance)
    Open

    Normal road approach, subject to weather and individual site restrictions. This marker is an access location, not a guarantee that every facility is operating.

  • BThornton Gap Entrance
    Open

    Normal road approach, subject to weather and individual site restrictions. This marker is an access location, not a guarantee that every facility is operating.

  • CSwift Run Gap Entrance
    Open

    Normal road approach, subject to weather and individual site restrictions. This marker is an access location, not a guarantee that every facility is operating.

  • DRockfish Gap Entrance (South Entrance)
    Open

    Normal road approach, subject to weather and individual site restrictions. This marker is an access location, not a guarantee that every facility is operating.

March in-park stays

three concessioner lodge/cabin properties, four family campgrounds, Dundo group camping and the separately identified PATC primitive cabins. Normal seasons are planning guidance, not vacancies. Opening/closing months are partial. Unverified means confirm directly. These are normal seasonal schedules, not room or campsite availability.

Frontcountry campground

  • 1Mathews Arm
    Closed

    Outside the normal operating season. Check the published calendar for your dates.

  • 2Big Meadows
    Part month

    The season normally begins or ends during this month. Confirm the dated operating calendar.

  • 3Lewis Mountain
    Part month

    The season normally begins or ends during this month. Confirm the dated operating calendar.

  • 4Loft Mountain
    Closed

    Outside the normal operating season. Check the published calendar for your dates.

Lodge/cabins

  • Skyland
    Part month

    The season normally begins or ends during this month. Confirm the dated operating calendar.

  • Big Meadows Lodge
    Closed

    Outside the normal operating season. Check the published calendar for your dates.

  • Lewis Mountain Cabins
    Closed

    Outside the normal operating season. Check the published calendar for your dates.

Separate campground area, confirm use and operating calendar

  • Dundo campground area
    Unverified

    A dependable full-month operating season is not established here. Confirm dates directly before booking.

Supplemental hike-in cabins, separate from road lodging

  • PATC primitive cabins
    Unverified

    A dependable full-month operating season is not established here. Confirm dates directly before booking.

Backcountry trips, permits and specialist travel need separate planning and are outside the frontcountry comparison.

April Quiet 40% of October · 127K avg Good 57°F / 37°F (14°C / 3°C)
Full
access
Limitedlodging Milder daytime walks. Lodge and campground openings continue.Read the April guide

April crowds

126,576 average April visits in 2021–2025.

Monthly recreation visits

47 annual records · 1979–2025

April recreation visits, 1979 to 2025NPS park-wide recreation visits for April in each year. The vertical scale starts at zero. Exact counts follow in the data table. Missing counts are gaps.0100k200k1979: 132,350 visits1980: 107,118 visits1981: 131,713 visits1982: 113,050 visits1983: 96,859 visits1984: 122,678 visits1985: 127,050 visits1986: 120,365 visits1987: 96,103 visits1988: 126,421 visits1989: 107,011 visits1990: 117,648 visits1991: 112,182 visits1992: 137,433 visits1993: 172,176 visits1994: 167,326 visits1995: 149,234 visits1996: 118,566 visits1997: 102,548 visits1998: 94,723 visits1999: 94,767 visits2000: 95,310 visits2001: 106,794 visits2002: 89,073 visits2003: 83,405 visits2004: 96,523 visits2005: 64,318 visits2006: 78,772 visits2007: 67,532 visits2008: 56,576 visits2009: 77,195 visits2010: 94,931 visits2011: 91,337 visits2012: 94,770 visits2013: 101,796 visits2014: 91,203 visits2015: 88,978 visits2016: 93,020 visits2017: 122,666 visits2018: 83,868 visits2019: 102,672 visits2020: 11,514 visits2021: 117,830 visits2022: 115,883 visits2023: 130,282 visits2024: 129,148 visits2025: 139,737 visits197919891999200920192025

Scroll the chart to see all years →

Hover, focus or tap a bar to see its year and value.

NPS recreation visits are visits, not unique visitors or a measure of how busy an individual trail feels. Counts can reflect closures, disruptions and changes in counting methods.

April weather

1991 through 2020 averages

Average high
57°F / 14°C
Average low
37°F / 3°C
Monthly precipitation
3.51 in / 89 mm

Big Meadows at about 3,540 ft supplies the ridge temperature normals. The rain normals shown in the table come from Luray 5 E at about 1,400 ft on the valley floor, not the ridge. Snowfall normals are not reported. The historical charts use Big Meadows observations and preserve missing rain data; they do not substitute Luray normals for observations.

April weather through the years at Big Meadows, VA.

Average daily high and low (°F)

32 complete high-temperature records · 27 complete low-temperature records

■ High■ Low

April: Average daily high and low (°F), 1935–2025Only complete calendar months are plotted. Gaps indicate missing or flagged daily observations. Exact values follow in the table.03570April 1940: average high 52.86 °FApril 1941: average high 67.33 °FApril 1943: average high 56.12 °FApril 1946: average high 59.33 °FApril 1948: average high 63.27 °FApril 1949: average high 58.67 °FApril 1954: average high 64.60 °FApril 1956: average high 54.84 °FApril 1957: average high 60.30 °FApril 1960: average high 62.54 °FApril 1961: average high 48.63 °FApril 1963: average high 58.12 °FApril 1964: average high 57.06 °FApril 1965: average high 55.72 °FApril 1966: average high 51.51 °FApril 1967: average high 59.24 °FApril 1968: average high 58.96 °FApril 1969: average high 57.31 °FApril 1970: average high 56.34 °FApril 1972: average high 56.56 °FApril 1973: average high 53.97 °FApril 1976: average high 59.29 °FApril 1977: average high 61.33 °FApril 1978: average high 56.88 °FApril 1980: average high 55.62 °FApril 1981: average high 60.20 °FApril 1983: average high 50.03 °FApril 1984: average high 51.69 °FApril 1985: average high 60.75 °FApril 1987: average high 51.24 °FApril 1988: average high 54.76 °FApril 1993: average high 56.01 °FApril 1936: average low 32.77 °FApril 1941: average low 38.91 °FApril 1943: average low 31.66 °FApril 1946: average low 34.38 °FApril 1947: average low 37.65 °FApril 1949: average low 34.03 °FApril 1954: average low 42.18 °FApril 1956: average low 33.88 °FApril 1958: average low 37.91 °FApril 1960: average low 42.06 °FApril 1961: average low 32.18 °FApril 1963: average low 35.95 °FApril 1964: average low 36.46 °FApril 1965: average low 35.50 °FApril 1966: average low 34.78 °FApril 1968: average low 37.64 °FApril 1969: average low 38.60 °FApril 1972: average low 32.22 °FApril 1973: average low 37.02 °FApril 1976: average low 36.01 °FApril 1977: average low 38.41 °FApril 1978: average low 35.07 °FApril 1980: average low 37.51 °FApril 1981: average low 38.06 °FApril 1983: average low 33.18 °FApril 1988: average low 30.07 °FApril 1993: average low 30.88 °F193519802025

Scroll the chart to see all years →

Hover, focus or tap a bar to see its year and value.

Monthly precipitation (inches)

29 complete rain records

April: Monthly precipitation (inches), 1935–2025Only complete calendar months are plotted. Gaps indicate missing or flagged daily observations. Exact values follow in the table.048April 1949: precipitation 2.77 inApril 1950: precipitation 1.64 inApril 1952: precipitation 7.59 inApril 1953: precipitation 5.39 inApril 1954: precipitation 4.46 inApril 1955: precipitation 2.94 inApril 1956: precipitation 2.61 inApril 1957: precipitation 4.66 inApril 1960: precipitation 3.09 inApril 1961: precipitation 6.38 inApril 1963: precipitation 1.26 inApril 1964: precipitation 6.19 inApril 1965: precipitation 2.15 inApril 1966: precipitation 4.43 inApril 1967: precipitation 0.90 inApril 1968: precipitation 2.05 inApril 1969: precipitation 1.46 inApril 1970: precipitation 4.75 inApril 1971: precipitation 2.35 inApril 1972: precipitation 3.33 inApril 1973: precipitation 4.92 inApril 1974: precipitation 2.54 inApril 1975: precipitation 1.95 inApril 1976: precipitation 2.38 inApril 1977: precipitation 2.24 inApril 1978: precipitation 1.94 inApril 1979: precipitation 5.17 inApril 1980: precipitation 7.92 inApril 1981: precipitation 3.70 in193519802025

Scroll the chart to see all years →

Hover, focus or tap a bar to see its year and value.

Big Meadows, VA station observations, not a park-wide average or forecast. Complete quality-screened calendar months only, separately by metric. Daily high/low means and total precipitation; incomplete months stay null. No interpolation or substitution. Completed years only; separate from 1991-2020 normals.

April in-park stays

three concessioner lodge/cabin properties, four family campgrounds, Dundo group camping and the separately identified PATC primitive cabins. Normal seasons are planning guidance, not vacancies. Opening/closing months are partial. Unverified means confirm directly. These are normal seasonal schedules, not room or campsite availability.

Frontcountry campground

  • 1Mathews Arm
    Part month

    The season normally begins or ends during this month. Confirm the dated operating calendar.

  • 2Big Meadows
    Open

    Within the normal operating season. This is not room or campsite availability.

  • 3Lewis Mountain
    Open

    Within the normal operating season. This is not room or campsite availability.

  • 4Loft Mountain
    Part month

    The season normally begins or ends during this month. Confirm the dated operating calendar.

Lodge/cabins

  • Skyland
    Open

    Within the normal operating season. This is not room or campsite availability.

  • Big Meadows Lodge
    Closed

    Outside the normal operating season. Check the published calendar for your dates.

  • Lewis Mountain Cabins
    Part month

    The season normally begins or ends during this month. Confirm the dated operating calendar.

Separate campground area, confirm use and operating calendar

  • Dundo campground area
    Unverified

    A dependable full-month operating season is not established here. Confirm dates directly before booking.

Supplemental hike-in cabins, separate from road lodging

  • PATC primitive cabins
    Unverified

    A dependable full-month operating season is not established here. Confirm dates directly before booking.

Backcountry trips, permits and specialist travel need separate planning and are outside the frontcountry comparison.

May Moderate 50% of October · 158K avg Good 64°F / 46°F (18°C / 8°C)
Full
access
Limitedlodging Broad seasonal choice, with Big Meadows Lodge normally opening during May.Read the May guide

May crowds

158,253 average May visits in 2021–2025.

Monthly recreation visits

47 annual records · 1979–2025

May recreation visits, 1979 to 2025NPS park-wide recreation visits for May in each year. The vertical scale starts at zero. Exact counts follow in the data table. Missing counts are gaps.0100k200k1979: 147,045 visits1980: 170,191 visits1981: 178,187 visits1982: 187,271 visits1983: 171,129 visits1984: 185,688 visits1985: 184,626 visits1986: 189,740 visits1987: 187,671 visits1988: 190,831 visits1989: 180,081 visits1990: 146,287 visits1991: 190,306 visits1992: 155,561 visits1993: 177,205 visits1994: 173,744 visits1995: 145,863 visits1996: 140,916 visits1997: 146,407 visits1998: 153,940 visits1999: 145,280 visits2000: 122,358 visits2001: 131,271 visits2002: 135,704 visits2003: 97,130 visits2004: 157,617 visits2005: 124,297 visits2006: 103,065 visits2007: 115,809 visits2008: 110,812 visits2009: 111,110 visits2010: 119,576 visits2011: 126,032 visits2012: 127,124 visits2013: 147,819 visits2014: 141,445 visits2015: 155,018 visits2016: 137,816 visits2017: 136,232 visits2018: 132,856 visits2019: 150,297 visits2020: 46,903 visits2021: 152,924 visits2022: 135,836 visits2023: 166,908 visits2024: 162,483 visits2025: 173,115 visits197919891999200920192025

Scroll the chart to see all years →

Hover, focus or tap a bar to see its year and value.

NPS recreation visits are visits, not unique visitors or a measure of how busy an individual trail feels. Counts can reflect closures, disruptions and changes in counting methods.

May weather

1991 through 2020 averages

Average high
64°F / 18°C
Average low
46°F / 8°C
Monthly precipitation
4.21 in / 107 mm

Big Meadows at about 3,540 ft supplies the ridge temperature normals. The rain normals shown in the table come from Luray 5 E at about 1,400 ft on the valley floor, not the ridge. Snowfall normals are not reported. The historical charts use Big Meadows observations and preserve missing rain data; they do not substitute Luray normals for observations.

May weather through the years at Big Meadows, VA.

Average daily high and low (°F)

38 complete high-temperature records · 36 complete low-temperature records

■ High■ Low

May: Average daily high and low (°F), 1935–2025Only complete calendar months are plotted. Gaps indicate missing or flagged daily observations. Exact values follow in the table.04080May 1936: average high 67.90 °FMay 1937: average high 64.16 °FMay 1939: average high 65.60 °FMay 1943: average high 71.26 °FMay 1945: average high 66.00 °FMay 1946: average high 67.47 °FMay 1947: average high 70.00 °FMay 1948: average high 67.51 °FMay 1949: average high 71.58 °FMay 1950: average high 67.74 °FMay 1957: average high 67.90 °FMay 1958: average high 65.54 °FMay 1959: average high 69.42 °FMay 1961: average high 60.47 °FMay 1962: average high 69.68 °FMay 1963: average high 64.53 °FMay 1965: average high 71.19 °FMay 1966: average high 65.28 °FMay 1967: average high 59.80 °FMay 1968: average high 61.67 °FMay 1969: average high 66.49 °FMay 1970: average high 68.61 °FMay 1974: average high 63.90 °FMay 1977: average high 68.90 °FMay 1978: average high 62.64 °FMay 1979: average high 63.46 °FMay 1980: average high 65.40 °FMay 1981: average high 62.70 °FMay 1982: average high 68.89 °FMay 1983: average high 61.97 °FMay 1984: average high 64.17 °FMay 1986: average high 65.88 °FMay 1987: average high 67.67 °FMay 1988: average high 63.77 °FMay 1995: average high 63.26 °FMay 1998: average high 63.58 °FMay 1999: average high 68.21 °FMay 2000: average high 66.62 °FMay 1935: average low 43.67 °FMay 1936: average low 48.55 °FMay 1939: average low 46.59 °FMay 1940: average low 43.66 °FMay 1941: average low 43.64 °FMay 1943: average low 48.13 °FMay 1945: average low 41.42 °FMay 1947: average low 43.93 °FMay 1948: average low 44.26 °FMay 1957: average low 48.20 °FMay 1959: average low 50.27 °FMay 1961: average low 41.16 °FMay 1962: average low 49.87 °FMay 1963: average low 44.08 °FMay 1964: average low 47.47 °FMay 1965: average low 51.93 °FMay 1966: average low 44.62 °FMay 1967: average low 39.86 °FMay 1968: average low 42.28 °FMay 1969: average low 47.55 °FMay 1970: average low 47.85 °FMay 1971: average low 40.30 °FMay 1974: average low 45.49 °FMay 1975: average low 47.99 °FMay 1977: average low 47.97 °FMay 1978: average low 44.76 °FMay 1980: average low 47.23 °FMay 1981: average low 42.16 °FMay 1983: average low 43.25 °FMay 1984: average low 44.34 °FMay 1986: average low 44.13 °FMay 1987: average low 45.19 °FMay 1993: average low 43.39 °FMay 1996: average low 46.36 °FMay 1998: average low 50.19 °FMay 2000: average low 48.70 °F193519802025

Scroll the chart to see all years →

Hover, focus or tap a bar to see its year and value.

Monthly precipitation (inches)

31 complete rain records

May: Monthly precipitation (inches), 1935–2025Only complete calendar months are plotted. Gaps indicate missing or flagged daily observations. Exact values follow in the table.0612May 1949: precipitation 4.91 inMay 1950: precipitation 6.89 inMay 1951: precipitation 1.99 inMay 1952: precipitation 6.08 inMay 1953: precipitation 6.14 inMay 1954: precipitation 5.14 inMay 1955: precipitation 3.59 inMay 1956: precipitation 2.09 inMay 1957: precipitation 3.51 inMay 1958: precipitation 4.47 inMay 1959: precipitation 3.18 inMay 1960: precipitation 9.27 inMay 1961: precipitation 4.65 inMay 1962: precipitation 3.57 inMay 1963: precipitation 1.19 inMay 1964: precipitation 1.89 inMay 1965: precipitation 2.83 inMay 1966: precipitation 3.21 inMay 1967: precipitation 3.84 inMay 1968: precipitation 6.59 inMay 1969: precipitation 2.97 inMay 1970: precipitation 2.59 inMay 1971: precipitation 11.60 inMay 1974: precipitation 6.30 inMay 1975: precipitation 3.97 inMay 1976: precipitation 6.25 inMay 1977: precipitation 1.76 inMay 1978: precipitation 7.59 inMay 1979: precipitation 3.77 inMay 1980: precipitation 3.81 inMay 1981: precipitation 5.82 in193519802025

Scroll the chart to see all years →

Hover, focus or tap a bar to see its year and value.

Big Meadows, VA station observations, not a park-wide average or forecast. Complete quality-screened calendar months only, separately by metric. Daily high/low means and total precipitation; incomplete months stay null. No interpolation or substitution. Completed years only; separate from 1991-2020 normals.

May in-park stays

three concessioner lodge/cabin properties, four family campgrounds, Dundo group camping and the separately identified PATC primitive cabins. Normal seasons are planning guidance, not vacancies. Opening/closing months are partial. Unverified means confirm directly. These are normal seasonal schedules, not room or campsite availability.

Frontcountry campground

  • 1Mathews Arm
    Open

    Within the normal operating season. This is not room or campsite availability.

  • 2Big Meadows
    Open

    Within the normal operating season. This is not room or campsite availability.

  • 3Lewis Mountain
    Open

    Within the normal operating season. This is not room or campsite availability.

  • 4Loft Mountain
    Open

    Within the normal operating season. This is not room or campsite availability.

Lodge/cabins

  • Skyland
    Open

    Within the normal operating season. This is not room or campsite availability.

  • Big Meadows Lodge
    Part month

    The season normally begins or ends during this month. Confirm the dated operating calendar.

  • Lewis Mountain Cabins
    Open

    Within the normal operating season. This is not room or campsite availability.

Separate campground area, confirm use and operating calendar

  • Dundo campground area
    Unverified

    A dependable full-month operating season is not established here. Confirm dates directly before booking.

Supplemental hike-in cabins, separate from road lodging

  • PATC primitive cabins
    Unverified

    A dependable full-month operating season is not established here. Confirm dates directly before booking.

Backcountry trips, permits and specialist travel need separate planning and are outside the frontcountry comparison.

June Moderate 53% of October · 169K avg Good 70°F / 54°F (21°C / 12°C)
Full
access
Limitedlodging Comfortable ridge daytime normals. Prepare for mountain rain and storms.Read the June guide

June crowds

169,075 average June visits in 2021–2025.

Monthly recreation visits

47 annual records · 1979–2025

June recreation visits, 1979 to 2025NPS park-wide recreation visits for June in each year. The vertical scale starts at zero. Exact counts follow in the data table. Missing counts are gaps.0125k250k1979: 136,996 visits1980: 194,184 visits1981: 202,230 visits1982: 198,058 visits1983: 184,854 visits1984: 206,444 visits1985: 230,790 visits1986: 190,786 visits1987: 178,897 visits1988: 185,082 visits1989: 199,961 visits1990: 182,619 visits1991: 195,592 visits1992: 197,999 visits1993: 185,276 visits1994: 181,290 visits1995: 201,137 visits1996: 187,366 visits1997: 162,372 visits1998: 143,583 visits1999: 134,151 visits2000: 133,186 visits2001: 155,811 visits2002: 164,106 visits2003: 126,203 visits2004: 143,049 visits2005: 131,690 visits2006: 109,042 visits2007: 125,902 visits2008: 121,783 visits2009: 121,161 visits2010: 127,861 visits2011: 137,580 visits2012: 142,242 visits2013: 136,277 visits2014: 142,300 visits2015: 138,916 visits2016: 158,017 visits2017: 163,193 visits2018: 149,418 visits2019: 170,492 visits2020: 180,311 visits2021: 162,890 visits2022: 165,442 visits2023: 160,576 visits2024: 189,379 visits2025: 167,090 visits197919891999200920192025

Scroll the chart to see all years →

Hover, focus or tap a bar to see its year and value.

NPS recreation visits are visits, not unique visitors or a measure of how busy an individual trail feels. Counts can reflect closures, disruptions and changes in counting methods.

June weather

1991 through 2020 averages

Average high
70°F / 21°C
Average low
54°F / 12°C
Monthly precipitation
4.76 in / 121 mm

Big Meadows at about 3,540 ft supplies the ridge temperature normals. The rain normals shown in the table come from Luray 5 E at about 1,400 ft on the valley floor, not the ridge. Snowfall normals are not reported. The historical charts use Big Meadows observations and preserve missing rain data; they do not substitute Luray normals for observations.

June weather through the years at Big Meadows, VA.

Average daily high and low (°F)

38 complete high-temperature records · 41 complete low-temperature records

■ High■ Low

June: Average daily high and low (°F), 1935–2025Only complete calendar months are plotted. Gaps indicate missing or flagged daily observations. Exact values follow in the table.04080June 1939: average high 72.80 °FJune 1941: average high 76.81 °FJune 1943: average high 79.34 °FJune 1945: average high 76.11 °FJune 1946: average high 75.86 °FJune 1947: average high 73.21 °FJune 1948: average high 76.72 °FJune 1950: average high 74.17 °FJune 1957: average high 72.73 °FJune 1958: average high 70.11 °FJune 1959: average high 72.10 °FJune 1960: average high 72.04 °FJune 1961: average high 72.61 °FJune 1962: average high 71.00 °FJune 1963: average high 72.48 °FJune 1965: average high 69.83 °FJune 1966: average high 74.95 °FJune 1967: average high 71.84 °FJune 1971: average high 73.06 °FJune 1972: average high 67.04 °FJune 1973: average high 73.55 °FJune 1974: average high 67.42 °FJune 1975: average high 70.97 °FJune 1976: average high 70.72 °FJune 1977: average high 70.13 °FJune 1978: average high 72.60 °FJune 1979: average high 68.97 °FJune 1980: average high 70.56 °FJune 1981: average high 72.97 °FJune 1982: average high 68.61 °FJune 1983: average high 71.62 °FJune 1984: average high 74.56 °FJune 1985: average high 70.64 °FJune 1986: average high 74.07 °FJune 1988: average high 72.86 °FJune 1989: average high 74.75 °FJune 1991: average high 73.07 °FJune 2001: average high 69.73 °FJune 1935: average low 54.52 °FJune 1936: average low 54.16 °FJune 1937: average low 60.10 °FJune 1939: average low 56.08 °FJune 1941: average low 51.01 °FJune 1943: average low 57.34 °FJune 1944: average low 54.52 °FJune 1945: average low 52.41 °FJune 1947: average low 51.45 °FJune 1948: average low 52.04 °FJune 1950: average low 53.49 °FJune 1957: average low 56.71 °FJune 1958: average low 51.76 °FJune 1959: average low 54.12 °FJune 1960: average low 52.54 °FJune 1961: average low 51.72 °FJune 1962: average low 53.22 °FJune 1963: average low 51.79 °FJune 1964: average low 54.34 °FJune 1965: average low 52.23 °FJune 1966: average low 52.77 °FJune 1967: average low 53.67 °FJune 1969: average low 55.94 °FJune 1971: average low 56.43 °FJune 1972: average low 49.26 °FJune 1973: average low 57.08 °FJune 1974: average low 50.92 °FJune 1976: average low 52.21 °FJune 1977: average low 49.83 °FJune 1978: average low 53.44 °FJune 1979: average low 51.31 °FJune 1980: average low 50.69 °FJune 1981: average low 53.21 °FJune 1982: average low 50.62 °FJune 1985: average low 50.83 °FJune 1986: average low 51.30 °FJune 1987: average low 52.25 °FJune 1989: average low 53.34 °FJune 1993: average low 48.27 °FJune 1999: average low 55.15 °FJune 2001: average low 55.73 °F193519802025

Scroll the chart to see all years →

Hover, focus or tap a bar to see its year and value.

Monthly precipitation (inches)

35 complete rain records

June: Monthly precipitation (inches), 1935–2025Only complete calendar months are plotted. Gaps indicate missing or flagged daily observations. Exact values follow in the table.09.519June 1949: precipitation 17.13 inJune 1950: precipitation 2.79 inJune 1951: precipitation 5.95 inJune 1952: precipitation 5.80 inJune 1953: precipitation 2.41 inJune 1954: precipitation 2.92 inJune 1955: precipitation 3.49 inJune 1956: precipitation 1.97 inJune 1957: precipitation 4.72 inJune 1958: precipitation 5.74 inJune 1959: precipitation 3.91 inJune 1960: precipitation 3.61 inJune 1961: precipitation 4.46 inJune 1962: precipitation 3.78 inJune 1963: precipitation 6.00 inJune 1964: precipitation 1.43 inJune 1965: precipitation 1.83 inJune 1966: precipitation 3.01 inJune 1967: precipitation 1.35 inJune 1968: precipitation 4.86 inJune 1969: precipitation 4.08 inJune 1970: precipitation 2.66 inJune 1971: precipitation 2.42 inJune 1972: precipitation 18.03 inJune 1973: precipitation 4.76 inJune 1974: precipitation 5.44 inJune 1975: precipitation 4.03 inJune 1976: precipitation 7.04 inJune 1977: precipitation 2.86 inJune 1978: precipitation 4.58 inJune 1979: precipitation 5.48 inJune 1980: precipitation 1.01 inJune 1981: precipitation 4.35 inJune 1990: precipitation 1.59 inJune 2001: precipitation 6.86 in193519802025

Scroll the chart to see all years →

Hover, focus or tap a bar to see its year and value.

Big Meadows, VA station observations, not a park-wide average or forecast. Complete quality-screened calendar months only, separately by metric. Daily high/low means and total precipitation; incomplete months stay null. No interpolation or substitution. Completed years only; separate from 1991-2020 normals.

June in-park stays

three concessioner lodge/cabin properties, four family campgrounds, Dundo group camping and the separately identified PATC primitive cabins. Normal seasons are planning guidance, not vacancies. Opening/closing months are partial. Unverified means confirm directly. These are normal seasonal schedules, not room or campsite availability.

Frontcountry campground

  • 1Mathews Arm
    Open

    Within the normal operating season. This is not room or campsite availability.

  • 2Big Meadows
    Open

    Within the normal operating season. This is not room or campsite availability.

  • 3Lewis Mountain
    Open

    Within the normal operating season. This is not room or campsite availability.

  • 4Loft Mountain
    Open

    Within the normal operating season. This is not room or campsite availability.

Lodge/cabins

  • Skyland
    Open

    Within the normal operating season. This is not room or campsite availability.

  • Big Meadows Lodge
    Open

    Within the normal operating season. This is not room or campsite availability.

  • Lewis Mountain Cabins
    Open

    Within the normal operating season. This is not room or campsite availability.

Separate campground area, confirm use and operating calendar

  • Dundo campground area
    Unverified

    A dependable full-month operating season is not established here. Confirm dates directly before booking.

Supplemental hike-in cabins, separate from road lodging

  • PATC primitive cabins
    Unverified

    A dependable full-month operating season is not established here. Confirm dates directly before booking.

Backcountry trips, permits and specialist travel need separate planning and are outside the frontcountry comparison.

July Moderate 59% of October · 187K avg Good 75°F / 59°F (24°C / 15°C)
Full
access
Limitedlodging The warmest ridge normal month. Valley weather can be hotter.Read the July guide

July crowds

186,931 average July visits in 2021–2025.

Monthly recreation visits

47 annual records · 1979–2025

July recreation visits, 1979 to 2025NPS park-wide recreation visits for July in each year. The vertical scale starts at zero. Exact counts follow in the data table. Missing counts are gaps.0175k350k1979: 185,666 visits1980: 247,966 visits1981: 255,740 visits1982: 251,514 visits1983: 288,667 visits1984: 257,704 visits1985: 267,876 visits1986: 262,840 visits1987: 241,363 visits1988: 264,339 visits1989: 275,850 visits1990: 233,944 visits1991: 257,898 visits1992: 282,037 visits1993: 307,932 visits1994: 262,617 visits1995: 268,003 visits1996: 245,265 visits1997: 220,690 visits1998: 199,104 visits1999: 176,878 visits2000: 178,581 visits2001: 213,461 visits2002: 224,404 visits2003: 177,960 visits2004: 167,700 visits2005: 165,894 visits2006: 151,457 visits2007: 158,668 visits2008: 136,795 visits2009: 163,916 visits2010: 175,626 visits2011: 178,786 visits2012: 147,518 visits2013: 159,170 visits2014: 172,792 visits2015: 169,303 visits2016: 195,953 visits2017: 199,031 visits2018: 178,769 visits2019: 167,335 visits2020: 244,677 visits2021: 198,114 visits2022: 184,485 visits2023: 193,381 visits2024: 170,529 visits2025: 188,144 visits197919891999200920192025

Scroll the chart to see all years →

Hover, focus or tap a bar to see its year and value.

NPS recreation visits are visits, not unique visitors or a measure of how busy an individual trail feels. Counts can reflect closures, disruptions and changes in counting methods.

July weather

1991 through 2020 averages

Average high
75°F / 24°C
Average low
59°F / 15°C
Monthly precipitation
4.12 in / 105 mm

Big Meadows at about 3,540 ft supplies the ridge temperature normals. The rain normals shown in the table come from Luray 5 E at about 1,400 ft on the valley floor, not the ridge. Snowfall normals are not reported. The historical charts use Big Meadows observations and preserve missing rain data; they do not substitute Luray normals for observations.

July weather through the years at Big Meadows, VA.

Average daily high and low (°F)

45 complete high-temperature records · 37 complete low-temperature records

■ High■ Low

July: Average daily high and low (°F), 1935–2025Only complete calendar months are plotted. Gaps indicate missing or flagged daily observations. Exact values follow in the table.04590July 1937: average high 72.29 °FJuly 1939: average high 72.42 °FJuly 1940: average high 73.81 °FJuly 1941: average high 77.02 °FJuly 1942: average high 80.68 °FJuly 1943: average high 76.29 °FJuly 1946: average high 76.68 °FJuly 1947: average high 74.97 °FJuly 1948: average high 77.48 °FJuly 1953: average high 78.85 °FJuly 1956: average high 74.20 °FJuly 1957: average high 76.09 °FJuly 1958: average high 75.99 °FJuly 1959: average high 75.19 °FJuly 1960: average high 75.79 °FJuly 1961: average high 75.65 °FJuly 1963: average high 75.04 °FJuly 1964: average high 75.15 °FJuly 1965: average high 74.86 °FJuly 1966: average high 77.71 °FJuly 1968: average high 74.68 °FJuly 1969: average high 75.44 °FJuly 1970: average high 76.13 °FJuly 1971: average high 72.98 °FJuly 1972: average high 73.74 °FJuly 1973: average high 74.81 °FJuly 1975: average high 72.84 °FJuly 1976: average high 72.57 °FJuly 1977: average high 78.80 °FJuly 1978: average high 72.91 °FJuly 1979: average high 71.90 °FJuly 1980: average high 76.58 °FJuly 1981: average high 72.39 °FJuly 1982: average high 74.87 °FJuly 1983: average high 77.62 °FJuly 1984: average high 72.35 °FJuly 1985: average high 74.06 °FJuly 1986: average high 77.42 °FJuly 1987: average high 79.77 °FJuly 1988: average high 79.31 °FJuly 1989: average high 76.59 °FJuly 1991: average high 79.51 °FJuly 1992: average high 78.02 °FJuly 1993: average high 79.35 °FJuly 1999: average high 79.60 °FJuly 1939: average low 55.07 °FJuly 1941: average low 53.26 °FJuly 1943: average low 56.02 °FJuly 1946: average low 55.01 °FJuly 1947: average low 53.73 °FJuly 1948: average low 55.62 °FJuly 1952: average low 60.17 °FJuly 1953: average low 58.04 °FJuly 1956: average low 57.76 °FJuly 1957: average low 56.84 °FJuly 1959: average low 58.84 °FJuly 1960: average low 57.44 °FJuly 1961: average low 56.16 °FJuly 1962: average low 54.27 °FJuly 1963: average low 54.85 °FJuly 1964: average low 57.37 °FJuly 1965: average low 56.53 °FJuly 1966: average low 57.91 °FJuly 1967: average low 56.35 °FJuly 1968: average low 57.49 °FJuly 1969: average low 59.14 °FJuly 1971: average low 56.55 °FJuly 1972: average low 57.64 °FJuly 1973: average low 58.49 °FJuly 1975: average low 56.27 °FJuly 1976: average low 51.82 °FJuly 1977: average low 58.38 °FJuly 1978: average low 56.32 °FJuly 1979: average low 57.07 °FJuly 1981: average low 54.09 °FJuly 1982: average low 54.96 °FJuly 1983: average low 54.40 °FJuly 1986: average low 57.87 °FJuly 1987: average low 55.61 °FJuly 1988: average low 52.90 °FJuly 1989: average low 54.99 °FJuly 1992: average low 55.08 °F193519802025

Scroll the chart to see all years →

Hover, focus or tap a bar to see its year and value.

Monthly precipitation (inches)

36 complete rain records

July: Monthly precipitation (inches), 1935–2025Only complete calendar months are plotted. Gaps indicate missing or flagged daily observations. Exact values follow in the table.0612July 1949: precipitation 8.26 inJuly 1950: precipitation 4.71 inJuly 1951: precipitation 3.96 inJuly 1952: precipitation 3.21 inJuly 1953: precipitation 2.27 inJuly 1954: precipitation 2.19 inJuly 1955: precipitation 2.11 inJuly 1956: precipitation 10.57 inJuly 1957: precipitation 2.09 inJuly 1958: precipitation 7.87 inJuly 1959: precipitation 2.23 inJuly 1960: precipitation 3.24 inJuly 1961: precipitation 3.01 inJuly 1962: precipitation 3.20 inJuly 1963: precipitation 1.86 inJuly 1964: precipitation 3.30 inJuly 1965: precipitation 1.91 inJuly 1966: precipitation 4.71 inJuly 1967: precipitation 4.74 inJuly 1968: precipitation 3.23 inJuly 1969: precipitation 3.98 inJuly 1970: precipitation 6.28 inJuly 1971: precipitation 4.22 inJuly 1972: precipitation 4.67 inJuly 1973: precipitation 3.10 inJuly 1974: precipitation 1.86 inJuly 1975: precipitation 7.45 inJuly 1976: precipitation 4.09 inJuly 1977: precipitation 1.76 inJuly 1978: precipitation 6.07 inJuly 1979: precipitation 3.59 inJuly 1980: precipitation 8.63 inJuly 1981: precipitation 11.35 inJuly 1992: precipitation 5.52 inJuly 1999: precipitation 4.66 inJuly 2000: precipitation 4.06 in193519802025

Scroll the chart to see all years →

Hover, focus or tap a bar to see its year and value.

Big Meadows, VA station observations, not a park-wide average or forecast. Complete quality-screened calendar months only, separately by metric. Daily high/low means and total precipitation; incomplete months stay null. No interpolation or substitution. Completed years only; separate from 1991-2020 normals.

July in-park stays

three concessioner lodge/cabin properties, four family campgrounds, Dundo group camping and the separately identified PATC primitive cabins. Normal seasons are planning guidance, not vacancies. Opening/closing months are partial. Unverified means confirm directly. These are normal seasonal schedules, not room or campsite availability.

Frontcountry campground

  • 1Mathews Arm
    Open

    Within the normal operating season. This is not room or campsite availability.

  • 2Big Meadows
    Open

    Within the normal operating season. This is not room or campsite availability.

  • 3Lewis Mountain
    Open

    Within the normal operating season. This is not room or campsite availability.

  • 4Loft Mountain
    Open

    Within the normal operating season. This is not room or campsite availability.

Lodge/cabins

  • Skyland
    Open

    Within the normal operating season. This is not room or campsite availability.

  • Big Meadows Lodge
    Open

    Within the normal operating season. This is not room or campsite availability.

  • Lewis Mountain Cabins
    Open

    Within the normal operating season. This is not room or campsite availability.

Separate campground area, confirm use and operating calendar

  • Dundo campground area
    Unverified

    A dependable full-month operating season is not established here. Confirm dates directly before booking.

Supplemental hike-in cabins, separate from road lodging

  • PATC primitive cabins
    Unverified

    A dependable full-month operating season is not established here. Confirm dates directly before booking.

Backcountry trips, permits and specialist travel need separate planning and are outside the frontcountry comparison.

August Moderate 56% of October · 179K avg Ideal 73°F / 58°F (23°C / 14°C)
Full
access
Limitedlodging Warm ridge days with broad seasonal stays.Read the August guide

August crowds

179,435 average August visits in 2021–2025.

Monthly recreation visits

47 annual records · 1979–2025

August recreation visits, 1979 to 2025NPS park-wide recreation visits for August in each year. The vertical scale starts at zero. Exact counts follow in the data table. Missing counts are gaps.0150k300k1979: 217,006 visits1980: 275,449 visits1981: 293,574 visits1982: 257,985 visits1983: 246,938 visits1984: 254,988 visits1985: 247,359 visits1986: 279,679 visits1987: 264,940 visits1988: 263,625 visits1989: 255,576 visits1990: 231,214 visits1991: 291,397 visits1992: 197,603 visits1993: 292,616 visits1994: 264,822 visits1995: 253,291 visits1996: 237,536 visits1997: 263,672 visits1998: 222,371 visits1999: 169,716 visits2000: 167,900 visits2001: 182,031 visits2002: 195,518 visits2003: 176,502 visits2004: 171,220 visits2005: 145,323 visits2006: 137,773 visits2007: 135,534 visits2008: 159,553 visits2009: 160,076 visits2010: 163,613 visits2011: 146,070 visits2012: 149,992 visits2013: 168,796 visits2014: 180,685 visits2015: 194,768 visits2016: 176,133 visits2017: 187,626 visits2018: 175,955 visits2019: 195,579 visits2020: 222,592 visits2021: 165,056 visits2022: 164,375 visits2023: 166,471 visits2024: 186,159 visits2025: 215,114 visits197919891999200920192025

Scroll the chart to see all years →

Hover, focus or tap a bar to see its year and value.

NPS recreation visits are visits, not unique visitors or a measure of how busy an individual trail feels. Counts can reflect closures, disruptions and changes in counting methods.

August weather

1991 through 2020 averages

Average high
73°F / 23°C
Average low
58°F / 14°C
Monthly precipitation
3.77 in / 96 mm

Big Meadows at about 3,540 ft supplies the ridge temperature normals. The rain normals shown in the table come from Luray 5 E at about 1,400 ft on the valley floor, not the ridge. Snowfall normals are not reported. The historical charts use Big Meadows observations and preserve missing rain data; they do not substitute Luray normals for observations.

August weather through the years at Big Meadows, VA.

Average daily high and low (°F)

45 complete high-temperature records · 40 complete low-temperature records

■ High■ Low

August: Average daily high and low (°F), 1935–2025Only complete calendar months are plotted. Gaps indicate missing or flagged daily observations. Exact values follow in the table.04080August 1937: average high 74.51 °FAugust 1939: average high 73.84 °FAugust 1943: average high 79.70 °FAugust 1946: average high 71.80 °FAugust 1947: average high 77.01 °FAugust 1949: average high 74.72 °FAugust 1952: average high 72.59 °FAugust 1953: average high 76.97 °FAugust 1956: average high 73.10 °FAugust 1957: average high 73.73 °FAugust 1958: average high 72.65 °FAugust 1960: average high 76.37 °FAugust 1961: average high 73.84 °FAugust 1962: average high 74.61 °FAugust 1963: average high 73.56 °FAugust 1964: average high 72.56 °FAugust 1965: average high 75.21 °FAugust 1966: average high 73.71 °FAugust 1967: average high 71.87 °FAugust 1968: average high 76.34 °FAugust 1969: average high 72.40 °FAugust 1971: average high 71.87 °FAugust 1972: average high 72.96 °FAugust 1973: average high 74.08 °FAugust 1974: average high 72.36 °FAugust 1976: average high 72.20 °FAugust 1977: average high 75.30 °FAugust 1978: average high 75.13 °FAugust 1979: average high 73.15 °FAugust 1980: average high 75.54 °FAugust 1981: average high 70.94 °FAugust 1982: average high 71.35 °FAugust 1983: average high 76.82 °FAugust 1984: average high 73.78 °FAugust 1985: average high 72.61 °FAugust 1986: average high 71.80 °FAugust 1987: average high 75.93 °FAugust 1988: average high 78.53 °FAugust 1991: average high 73.55 °FAugust 1992: average high 72.89 °FAugust 1993: average high 76.18 °FAugust 1995: average high 73.32 °FAugust 1998: average high 72.69 °FAugust 1999: average high 77.37 °FAugust 2000: average high 70.75 °FAugust 1939: average low 57.86 °FAugust 1941: average low 51.34 °FAugust 1942: average low 55.36 °FAugust 1943: average low 54.98 °FAugust 1944: average low 53.61 °FAugust 1945: average low 52.70 °FAugust 1946: average low 50.79 °FAugust 1949: average low 55.46 °FAugust 1952: average low 58.00 °FAugust 1953: average low 57.07 °FAugust 1956: average low 56.40 °FAugust 1957: average low 54.05 °FAugust 1958: average low 56.22 °FAugust 1960: average low 58.79 °FAugust 1961: average low 55.88 °FAugust 1962: average low 54.83 °FAugust 1963: average low 52.64 °FAugust 1964: average low 54.93 °FAugust 1965: average low 56.58 °FAugust 1966: average low 56.28 °FAugust 1967: average low 56.22 °FAugust 1968: average low 57.17 °FAugust 1969: average low 55.91 °FAugust 1971: average low 54.98 °FAugust 1972: average low 56.07 °FAugust 1973: average low 59.53 °FAugust 1974: average low 56.24 °FAugust 1976: average low 49.12 °FAugust 1977: average low 56.87 °FAugust 1978: average low 60.06 °FAugust 1979: average low 56.57 °FAugust 1980: average low 58.05 °FAugust 1981: average low 52.15 °FAugust 1983: average low 55.71 °FAugust 1984: average low 56.88 °FAugust 1985: average low 55.75 °FAugust 1987: average low 52.59 °FAugust 1993: average low 51.36 °FAugust 1995: average low 60.24 °FAugust 1998: average low 59.04 °F193519802025

Scroll the chart to see all years →

Hover, focus or tap a bar to see its year and value.

Monthly precipitation (inches)

33 complete rain records

August: Monthly precipitation (inches), 1935–2025Only complete calendar months are plotted. Gaps indicate missing or flagged daily observations. Exact values follow in the table.01224August 1949: precipitation 8.68 inAugust 1951: precipitation 4.21 inAugust 1952: precipitation 10.76 inAugust 1953: precipitation 5.40 inAugust 1954: precipitation 3.26 inAugust 1955: precipitation 23.87 inAugust 1956: precipitation 4.86 inAugust 1957: precipitation 1.25 inAugust 1958: precipitation 5.49 inAugust 1959: precipitation 3.57 inAugust 1960: precipitation 5.64 inAugust 1961: precipitation 6.99 inAugust 1962: precipitation 1.27 inAugust 1963: precipitation 2.66 inAugust 1964: precipitation 2.51 inAugust 1965: precipitation 4.49 inAugust 1966: precipitation 2.71 inAugust 1967: precipitation 8.74 inAugust 1969: precipitation 4.73 inAugust 1970: precipitation 3.78 inAugust 1971: precipitation 6.47 inAugust 1972: precipitation 2.30 inAugust 1973: precipitation 6.23 inAugust 1974: precipitation 4.14 inAugust 1975: precipitation 4.83 inAugust 1976: precipitation 1.94 inAugust 1977: precipitation 5.55 inAugust 1978: precipitation 3.41 inAugust 1979: precipitation 8.01 inAugust 1980: precipitation 6.42 inAugust 1981: precipitation 2.86 inAugust 1992: precipitation 3.93 inAugust 2000: precipitation 4.21 in193519802025

Scroll the chart to see all years →

Hover, focus or tap a bar to see its year and value.

Big Meadows, VA station observations, not a park-wide average or forecast. Complete quality-screened calendar months only, separately by metric. Daily high/low means and total precipitation; incomplete months stay null. No interpolation or substitution. Completed years only; separate from 1991-2020 normals.

August in-park stays

three concessioner lodge/cabin properties, four family campgrounds, Dundo group camping and the separately identified PATC primitive cabins. Normal seasons are planning guidance, not vacancies. Opening/closing months are partial. Unverified means confirm directly. These are normal seasonal schedules, not room or campsite availability.

Frontcountry campground

  • 1Mathews Arm
    Open

    Within the normal operating season. This is not room or campsite availability.

  • 2Big Meadows
    Open

    Within the normal operating season. This is not room or campsite availability.

  • 3Lewis Mountain
    Open

    Within the normal operating season. This is not room or campsite availability.

  • 4Loft Mountain
    Open

    Within the normal operating season. This is not room or campsite availability.

Lodge/cabins

  • Skyland
    Open

    Within the normal operating season. This is not room or campsite availability.

  • Big Meadows Lodge
    Open

    Within the normal operating season. This is not room or campsite availability.

  • Lewis Mountain Cabins
    Open

    Within the normal operating season. This is not room or campsite availability.

Separate campground area, confirm use and operating calendar

  • Dundo campground area
    Unverified

    A dependable full-month operating season is not established here. Confirm dates directly before booking.

Supplemental hike-in cabins, separate from road lodging

  • PATC primitive cabins
    Unverified

    A dependable full-month operating season is not established here. Confirm dates directly before booking.

Backcountry trips, permits and specialist travel need separate planning and are outside the frontcountry comparison.

September Moderate 48% of October · 153K avg Good 69°F / 52°F (21°C / 11°C)
Full
access
Limitedlodging Our pick for mild ridge walks and lower average visits than October.Read the September guide

September crowds

152,559 average September visits in 2021–2025.

Monthly recreation visits

47 annual records · 1979–2025

September recreation visits, 1979 to 2025NPS park-wide recreation visits for September in each year. The vertical scale starts at zero. Exact counts follow in the data table. Missing counts are gaps.0125k250k1979: 167,785 visits1980: 182,916 visits1981: 186,017 visits1982: 209,679 visits1983: 200,557 visits1984: 208,824 visits1985: 245,301 visits1986: 188,774 visits1987: 150,462 visits1988: 218,231 visits1989: 199,822 visits1990: 216,835 visits1991: 218,180 visits1992: 184,121 visits1993: 199,595 visits1994: 216,026 visits1995: 193,784 visits1996: 117,518 visits1997: 155,429 visits1998: 161,099 visits1999: 128,884 visits2000: 148,990 visits2001: 179,341 visits2002: 143,243 visits2003: 82,865 visits2004: 117,324 visits2005: 113,659 visits2006: 109,449 visits2007: 137,702 visits2008: 87,459 visits2009: 124,997 visits2010: 150,140 visits2011: 112,131 visits2012: 140,267 visits2013: 139,508 visits2014: 130,281 visits2015: 140,852 visits2016: 147,462 visits2017: 156,788 visits2018: 109,786 visits2019: 176,271 visits2020: 202,100 visits2021: 161,016 visits2022: 145,704 visits2023: 146,808 visits2024: 155,791 visits2025: 153,478 visits197919891999200920192025

Scroll the chart to see all years →

Hover, focus or tap a bar to see its year and value.

NPS recreation visits are visits, not unique visitors or a measure of how busy an individual trail feels. Counts can reflect closures, disruptions and changes in counting methods.

September weather

1991 through 2020 averages

Average high
69°F / 21°C
Average low
52°F / 11°C
Monthly precipitation
5.42 in / 138 mm

Big Meadows at about 3,540 ft supplies the ridge temperature normals. The rain normals shown in the table come from Luray 5 E at about 1,400 ft on the valley floor, not the ridge. Snowfall normals are not reported. The historical charts use Big Meadows observations and preserve missing rain data; they do not substitute Luray normals for observations.

September weather through the years at Big Meadows, VA.

Average daily high and low (°F)

35 complete high-temperature records · 39 complete low-temperature records

■ High■ Low

September: Average daily high and low (°F), 1935–2025Only complete calendar months are plotted. Gaps indicate missing or flagged daily observations. Exact values follow in the table.04080September 1939: average high 71.42 °FSeptember 1941: average high 73.86 °FSeptember 1942: average high 70.74 °FSeptember 1943: average high 69.05 °FSeptember 1945: average high 74.76 °FSeptember 1946: average high 70.29 °FSeptember 1948: average high 69.49 °FSeptember 1952: average high 68.10 °FSeptember 1953: average high 69.75 °FSeptember 1956: average high 64.63 °FSeptember 1958: average high 68.47 °FSeptember 1960: average high 68.04 °FSeptember 1963: average high 66.46 °FSeptember 1965: average high 69.55 °FSeptember 1966: average high 64.80 °FSeptember 1967: average high 63.67 °FSeptember 1968: average high 69.72 °FSeptember 1969: average high 66.47 °FSeptember 1970: average high 72.73 °FSeptember 1971: average high 67.24 °FSeptember 1972: average high 67.86 °FSeptember 1973: average high 71.41 °FSeptember 1975: average high 64.33 °FSeptember 1977: average high 69.13 °FSeptember 1978: average high 69.69 °FSeptember 1979: average high 65.64 °FSeptember 1980: average high 71.20 °FSeptember 1981: average high 66.19 °FSeptember 1982: average high 66.93 °FSeptember 1983: average high 69.81 °FSeptember 1984: average high 65.71 °FSeptember 1986: average high 67.78 °FSeptember 1989: average high 70.84 °FSeptember 1994: average high 65.05 °FSeptember 1995: average high 64.33 °FSeptember 1935: average low 50.64 °FSeptember 1939: average low 52.18 °FSeptember 1941: average low 48.82 °FSeptember 1942: average low 48.34 °FSeptember 1943: average low 46.56 °FSeptember 1944: average low 49.38 °FSeptember 1945: average low 52.96 °FSeptember 1946: average low 48.06 °FSeptember 1947: average low 49.57 °FSeptember 1948: average low 48.03 °FSeptember 1950: average low 50.34 °FSeptember 1952: average low 50.89 °FSeptember 1953: average low 50.48 °FSeptember 1956: average low 48.11 °FSeptember 1957: average low 52.29 °FSeptember 1958: average low 50.10 °FSeptember 1959: average low 53.10 °FSeptember 1960: average low 52.14 °FSeptember 1961: average low 52.38 °FSeptember 1962: average low 47.25 °FSeptember 1963: average low 44.29 °FSeptember 1965: average low 54.01 °FSeptember 1966: average low 48.40 °FSeptember 1967: average low 46.15 °FSeptember 1968: average low 50.13 °FSeptember 1969: average low 50.02 °FSeptember 1970: average low 53.69 °FSeptember 1971: average low 54.57 °FSeptember 1974: average low 48.81 °FSeptember 1975: average low 47.30 °FSeptember 1977: average low 53.31 °FSeptember 1978: average low 52.71 °FSeptember 1979: average low 49.63 °FSeptember 1980: average low 52.97 °FSeptember 1981: average low 47.94 °FSeptember 1982: average low 47.55 °FSeptember 1984: average low 46.71 °FSeptember 1986: average low 48.97 °FSeptember 1995: average low 50.51 °F193519802025

Scroll the chart to see all years →

Hover, focus or tap a bar to see its year and value.

Monthly precipitation (inches)

34 complete rain records

September: Monthly precipitation (inches), 1935–2025Only complete calendar months are plotted. Gaps indicate missing or flagged daily observations. Exact values follow in the table.0918September 1948: precipitation 6.07 inSeptember 1950: precipitation 6.01 inSeptember 1951: precipitation 1.78 inSeptember 1952: precipitation 6.72 inSeptember 1953: precipitation 1.67 inSeptember 1955: precipitation 3.06 inSeptember 1956: precipitation 7.47 inSeptember 1957: precipitation 6.71 inSeptember 1958: precipitation 1.81 inSeptember 1959: precipitation 12.80 inSeptember 1960: precipitation 5.35 inSeptember 1961: precipitation 2.68 inSeptember 1962: precipitation 2.58 inSeptember 1963: precipitation 3.02 inSeptember 1964: precipitation 3.93 inSeptember 1965: precipitation 4.10 inSeptember 1966: precipitation 12.43 inSeptember 1967: precipitation 5.15 inSeptember 1968: precipitation 2.49 inSeptember 1969: precipitation 5.48 inSeptember 1970: precipitation 1.28 inSeptember 1971: precipitation 6.19 inSeptember 1972: precipitation 3.46 inSeptember 1973: precipitation 3.37 inSeptember 1974: precipitation 3.08 inSeptember 1975: precipitation 11.87 inSeptember 1976: precipitation 6.35 inSeptember 1977: precipitation 3.94 inSeptember 1978: precipitation 0.69 inSeptember 1979: precipitation 17.09 inSeptember 1980: precipitation 2.11 inSeptember 1981: precipitation 2.68 inSeptember 1983: precipitation 2.50 inSeptember 1990: precipitation 3.62 in193519802025

Scroll the chart to see all years →

Hover, focus or tap a bar to see its year and value.

Big Meadows, VA station observations, not a park-wide average or forecast. Complete quality-screened calendar months only, separately by metric. Daily high/low means and total precipitation; incomplete months stay null. No interpolation or substitution. Completed years only; separate from 1991-2020 normals.

September in-park stays

three concessioner lodge/cabin properties, four family campgrounds, Dundo group camping and the separately identified PATC primitive cabins. Normal seasons are planning guidance, not vacancies. Opening/closing months are partial. Unverified means confirm directly. These are normal seasonal schedules, not room or campsite availability.

Frontcountry campground

  • 1Mathews Arm
    Open

    Within the normal operating season. This is not room or campsite availability.

  • 2Big Meadows
    Open

    Within the normal operating season. This is not room or campsite availability.

  • 3Lewis Mountain
    Open

    Within the normal operating season. This is not room or campsite availability.

  • 4Loft Mountain
    Open

    Within the normal operating season. This is not room or campsite availability.

Lodge/cabins

  • Skyland
    Open

    Within the normal operating season. This is not room or campsite availability.

  • Big Meadows Lodge
    Open

    Within the normal operating season. This is not room or campsite availability.

  • Lewis Mountain Cabins
    Open

    Within the normal operating season. This is not room or campsite availability.

Separate campground area, confirm use and operating calendar

  • Dundo campground area
    Unverified

    A dependable full-month operating season is not established here. Confirm dates directly before booking.

Supplemental hike-in cabins, separate from road lodging

  • PATC primitive cabins
    Unverified

    A dependable full-month operating season is not established here. Confirm dates directly before booking.

Backcountry trips, permits and specialist travel need separate planning and are outside the frontcountry comparison.

October Peak 100% of October · 319K avg Good 58°F / 42°F (14°C / 5°C)
Full
access
Limitedlodging Peak average visits. A cooler alternative for autumn scenery.Read the October guide

October crowds

318,584 average October visits in 2021–2025.

Monthly recreation visits

47 annual records · 1979–2025

October recreation visits, 1979 to 2025NPS park-wide recreation visits for October in each year. The vertical scale starts at zero. Exact counts follow in the data table. Missing counts are gaps.0225k450k1979: 291,735 visits1980: 318,121 visits1981: 352,936 visits1982: 358,818 visits1983: 354,062 visits1984: 378,194 visits1985: 381,497 visits1986: 341,440 visits1987: 411,659 visits1988: 420,713 visits1989: 382,677 visits1990: 333,463 visits1991: 381,661 visits1992: 395,980 visits1993: 381,260 visits1994: 409,900 visits1995: 293,109 visits1996: 308,790 visits1997: 261,344 visits1998: 300,207 visits1999: 286,995 visits2000: 346,913 visits2001: 303,514 visits2002: 193,166 visits2003: 245,792 visits2004: 240,216 visits2005: 161,907 visits2006: 233,542 visits2007: 206,362 visits2008: 220,661 visits2009: 217,307 visits2010: 281,998 visits2011: 238,482 visits2012: 235,180 visits2013: 112,754 visits2014: 252,800 visits2015: 257,854 visits2016: 263,082 visits2017: 244,484 visits2018: 202,362 visits2019: 236,554 visits2020: 365,398 visits2021: 295,326 visits2022: 298,672 visits2023: 308,222 visits2024: 361,136 visits2025: 329,565 visits197919891999200920192025

Scroll the chart to see all years →

Hover, focus or tap a bar to see its year and value.

NPS recreation visits are visits, not unique visitors or a measure of how busy an individual trail feels. Counts can reflect closures, disruptions and changes in counting methods.

October weather

1991 through 2020 averages

Average high
58°F / 14°C
Average low
42°F / 5°C
Monthly precipitation
3.17 in / 81 mm

Big Meadows at about 3,540 ft supplies the ridge temperature normals. The rain normals shown in the table come from Luray 5 E at about 1,400 ft on the valley floor, not the ridge. Snowfall normals are not reported. The historical charts use Big Meadows observations and preserve missing rain data; they do not substitute Luray normals for observations.

October weather through the years at Big Meadows, VA.

Average daily high and low (°F)

40 complete high-temperature records · 36 complete low-temperature records

■ High■ Low

October: Average daily high and low (°F), 1935–2025Only complete calendar months are plotted. Gaps indicate missing or flagged daily observations. Exact values follow in the table.04080October 1939: average high 60.79 °FOctober 1940: average high 61.35 °FOctober 1941: average high 71.91 °FOctober 1942: average high 61.36 °FOctober 1943: average high 58.16 °FOctober 1945: average high 60.34 °FOctober 1948: average high 57.61 °FOctober 1953: average high 63.56 °FOctober 1955: average high 59.91 °FOctober 1956: average high 57.96 °FOctober 1957: average high 52.80 °FOctober 1958: average high 57.57 °FOctober 1959: average high 59.41 °FOctober 1960: average high 59.12 °FOctober 1961: average high 61.82 °FOctober 1962: average high 59.90 °FOctober 1963: average high 66.48 °FOctober 1964: average high 54.87 °FOctober 1965: average high 53.42 °FOctober 1966: average high 56.33 °FOctober 1967: average high 56.94 °FOctober 1969: average high 58.00 °FOctober 1970: average high 58.38 °FOctober 1971: average high 60.19 °FOctober 1974: average high 61.68 °FOctober 1975: average high 61.97 °FOctober 1976: average high 51.14 °FOctober 1977: average high 54.33 °FOctober 1978: average high 57.57 °FOctober 1980: average high 54.93 °FOctober 1981: average high 54.99 °FOctober 1982: average high 56.56 °FOctober 1983: average high 56.54 °FOctober 1984: average high 63.30 °FOctober 1986: average high 60.23 °FOctober 1987: average high 53.90 °FOctober 1989: average high 61.42 °FOctober 1990: average high 58.43 °FOctober 1992: average high 60.20 °FOctober 2000: average high 60.11 °FOctober 1937: average low 40.16 °FOctober 1939: average low 40.54 °FOctober 1941: average low 43.14 °FOctober 1942: average low 40.79 °FOctober 1943: average low 38.31 °FOctober 1945: average low 38.23 °FOctober 1946: average low 42.93 °FOctober 1948: average low 35.91 °FOctober 1953: average low 43.76 °FOctober 1955: average low 41.52 °FOctober 1956: average low 43.61 °FOctober 1957: average low 36.84 °FOctober 1958: average low 39.80 °FOctober 1959: average low 43.65 °FOctober 1960: average low 40.65 °FOctober 1961: average low 39.15 °FOctober 1962: average low 42.00 °FOctober 1963: average low 44.59 °FOctober 1964: average low 37.39 °FOctober 1965: average low 37.64 °FOctober 1966: average low 38.01 °FOctober 1967: average low 39.33 °FOctober 1969: average low 39.54 °FOctober 1970: average low 43.30 °FOctober 1971: average low 47.78 °FOctober 1974: average low 37.23 °FOctober 1975: average low 41.81 °FOctober 1976: average low 35.83 °FOctober 1977: average low 38.06 °FOctober 1978: average low 37.59 °FOctober 1979: average low 37.16 °FOctober 1980: average low 34.65 °FOctober 1981: average low 34.78 °FOctober 1983: average low 38.95 °FOctober 1984: average low 47.68 °FOctober 1988: average low 27.38 °F193519802025

Scroll the chart to see all years →

Hover, focus or tap a bar to see its year and value.

Monthly precipitation (inches)

34 complete rain records

October: Monthly precipitation (inches), 1935–2025Only complete calendar months are plotted. Gaps indicate missing or flagged daily observations. Exact values follow in the table.0816October 1948: precipitation 4.94 inOctober 1949: precipitation 5.06 inOctober 1950: precipitation 4.60 inOctober 1951: precipitation 1.19 inOctober 1952: precipitation 1.53 inOctober 1953: precipitation 3.80 inOctober 1954: precipitation 13.11 inOctober 1955: precipitation 2.49 inOctober 1956: precipitation 11.01 inOctober 1957: precipitation 5.43 inOctober 1958: precipitation 3.25 inOctober 1960: precipitation 2.13 inOctober 1961: precipitation 4.55 inOctober 1962: precipitation 2.99 inOctober 1963: precipitation 0.04 inOctober 1964: precipitation 3.78 inOctober 1965: precipitation 2.71 inOctober 1966: precipitation 3.14 inOctober 1967: precipitation 5.00 inOctober 1968: precipitation 4.48 inOctober 1969: precipitation 1.64 inOctober 1970: precipitation 8.06 inOctober 1971: precipitation 11.36 inOctober 1972: precipitation 15.07 inOctober 1973: precipitation 6.80 inOctober 1974: precipitation 1.00 inOctober 1975: precipitation 4.26 inOctober 1976: precipitation 12.07 inOctober 1977: precipitation 4.80 inOctober 1978: precipitation 1.14 inOctober 1980: precipitation 3.57 inOctober 1981: precipitation 5.96 inOctober 1982: precipitation 3.16 inOctober 2000: precipitation 0.13 in193519802025

Scroll the chart to see all years →

Hover, focus or tap a bar to see its year and value.

Big Meadows, VA station observations, not a park-wide average or forecast. Complete quality-screened calendar months only, separately by metric. Daily high/low means and total precipitation; incomplete months stay null. No interpolation or substitution. Completed years only; separate from 1991-2020 normals.

October in-park stays

three concessioner lodge/cabin properties, four family campgrounds, Dundo group camping and the separately identified PATC primitive cabins. Normal seasons are planning guidance, not vacancies. Opening/closing months are partial. Unverified means confirm directly. These are normal seasonal schedules, not room or campsite availability.

Frontcountry campground

  • 1Mathews Arm
    Open

    Within the normal operating season. This is not room or campsite availability.

  • 2Big Meadows
    Open

    Within the normal operating season. This is not room or campsite availability.

  • 3Lewis Mountain
    Open

    Within the normal operating season. This is not room or campsite availability.

  • 4Loft Mountain
    Open

    Within the normal operating season. This is not room or campsite availability.

Lodge/cabins

  • Skyland
    Open

    Within the normal operating season. This is not room or campsite availability.

  • Big Meadows Lodge
    Open

    Within the normal operating season. This is not room or campsite availability.

  • Lewis Mountain Cabins
    Open

    Within the normal operating season. This is not room or campsite availability.

Separate campground area, confirm use and operating calendar

  • Dundo campground area
    Unverified

    A dependable full-month operating season is not established here. Confirm dates directly before booking.

Supplemental hike-in cabins, separate from road lodging

  • PATC primitive cabins
    Unverified

    A dependable full-month operating season is not established here. Confirm dates directly before booking.

Backcountry trips, permits and specialist travel need separate planning and are outside the frontcountry comparison.

November Moderate 48% of October · 152K avg Mixed 48°F / 32°F (9°C / 0°C) Limitedaccess Limitedlodging Seasonal stays close in stages and nights approach freezing.Read the November guide

November crowds

151,769 average November visits in 2021–2025.

Monthly recreation visits

47 annual records · 1979–2025

November recreation visits, 1979 to 2025NPS park-wide recreation visits for November in each year. The vertical scale starts at zero. Exact counts follow in the data table. Missing counts are gaps.0100k200k1979: 93,001 visits1980: 85,970 visits1981: 67,573 visits1982: 68,751 visits1983: 92,275 visits1984: 90,497 visits1985: 90,212 visits1986: 95,804 visits1987: 81,548 visits1988: 91,086 visits1989: 89,449 visits1990: 126,480 visits1991: 89,303 visits1992: 102,401 visits1993: 105,255 visits1994: 109,372 visits1995: 94,778 visits1996: 80,667 visits1997: 108,985 visits1998: 107,417 visits1999: 89,425 visits2000: 90,044 visits2001: 99,177 visits2002: 112,214 visits2003: 94,173 visits2004: 66,531 visits2005: 115,249 visits2006: 66,421 visits2007: 88,971 visits2008: 90,168 visits2009: 74,013 visits2010: 89,312 visits2011: 89,114 visits2012: 74,648 visits2013: 98,409 visits2014: 74,015 visits2015: 86,953 visits2016: 142,558 visits2017: 114,778 visits2018: 119,320 visits2019: 127,014 visits2020: 152,674 visits2021: 168,956 visits2022: 114,473 visits2023: 138,453 visits2024: 170,397 visits2025: 166,566 visits197919891999200920192025

Scroll the chart to see all years →

Hover, focus or tap a bar to see its year and value.

NPS recreation visits are visits, not unique visitors or a measure of how busy an individual trail feels. Counts can reflect closures, disruptions and changes in counting methods.

November weather

1991 through 2020 averages

Average high
48°F / 9°C
Average low
32°F / 0°C
Monthly precipitation
3.21 in / 82 mm

Big Meadows at about 3,540 ft supplies the ridge temperature normals. The rain normals shown in the table come from Luray 5 E at about 1,400 ft on the valley floor, not the ridge. Snowfall normals are not reported. The historical charts use Big Meadows observations and preserve missing rain data; they do not substitute Luray normals for observations.

November weather through the years at Big Meadows, VA.

Average daily high and low (°F)

33 complete high-temperature records · 29 complete low-temperature records

■ High■ Low

November: Average daily high and low (°F), 1935–2025Only complete calendar months are plotted. Gaps indicate missing or flagged daily observations. Exact values follow in the table.03060November 1936: average high 43.86 °FNovember 1937: average high 45.00 °FNovember 1940: average high 48.55 °FNovember 1941: average high 58.14 °FNovember 1945: average high 50.07 °FNovember 1946: average high 54.45 °FNovember 1948: average high 52.06 °FNovember 1949: average high 47.86 °FNovember 1950: average high 48.81 °FNovember 1956: average high 46.71 °FNovember 1958: average high 53.35 °FNovember 1959: average high 48.17 °FNovember 1960: average high 51.54 °FNovember 1962: average high 41.80 °FNovember 1963: average high 47.13 °FNovember 1964: average high 53.71 °FNovember 1967: average high 42.21 °FNovember 1968: average high 46.23 °FNovember 1970: average high 45.17 °FNovember 1971: average high 46.59 °FNovember 1974: average high 49.47 °FNovember 1976: average high 42.80 °FNovember 1978: average high 51.72 °FNovember 1979: average high 50.27 °FNovember 1980: average high 45.90 °FNovember 1981: average high 47.37 °FNovember 1982: average high 50.86 °FNovember 1983: average high 47.71 °FNovember 1984: average high 45.06 °FNovember 1985: average high 54.07 °FNovember 1987: average high 51.76 °FNovember 1989: average high 47.16 °FNovember 2000: average high 43.96 °FNovember 1936: average low 27.52 °FNovember 1937: average low 30.51 °FNovember 1941: average low 30.51 °FNovember 1945: average low 30.85 °FNovember 1946: average low 33.71 °FNovember 1948: average low 34.12 °FNovember 1949: average low 27.38 °FNovember 1950: average low 29.27 °FNovember 1956: average low 30.28 °FNovember 1958: average low 33.99 °FNovember 1959: average low 28.63 °FNovember 1960: average low 32.97 °FNovember 1961: average low 31.90 °FNovember 1962: average low 26.83 °FNovember 1963: average low 32.40 °FNovember 1964: average low 34.76 °FNovember 1965: average low 31.27 °FNovember 1967: average low 25.89 °FNovember 1968: average low 30.46 °FNovember 1969: average low 28.50 °FNovember 1970: average low 31.63 °FNovember 1971: average low 29.12 °FNovember 1976: average low 23.18 °FNovember 1977: average low 33.04 °FNovember 1979: average low 34.63 °FNovember 1980: average low 25.82 °FNovember 1981: average low 30.06 °FNovember 1983: average low 30.83 °FNovember 1984: average low 27.10 °F193519802025

Scroll the chart to see all years →

Hover, focus or tap a bar to see its year and value.

Monthly precipitation (inches)

29 complete rain records

November: Monthly precipitation (inches), 1935–2025Only complete calendar months are plotted. Gaps indicate missing or flagged daily observations. Exact values follow in the table.08.517November 1948: precipitation 5.23 inNovember 1949: precipitation 1.09 inNovember 1951: precipitation 5.23 inNovember 1953: precipitation 3.19 inNovember 1954: precipitation 3.79 inNovember 1955: precipitation 1.63 inNovember 1956: precipitation 2.18 inNovember 1957: precipitation 3.81 inNovember 1958: precipitation 1.80 inNovember 1959: precipitation 1.81 inNovember 1960: precipitation 2.12 inNovember 1961: precipitation 3.29 inNovember 1962: precipitation 7.35 inNovember 1964: precipitation 4.49 inNovember 1965: precipitation 1.12 inNovember 1967: precipitation 1.67 inNovember 1969: precipitation 5.69 inNovember 1970: precipitation 7.51 inNovember 1971: precipitation 2.78 inNovember 1974: precipitation 2.25 inNovember 1975: precipitation 1.93 inNovember 1976: precipitation 1.26 inNovember 1977: precipitation 16.58 inNovember 1978: precipitation 3.12 inNovember 1979: precipitation 5.28 inNovember 1980: precipitation 3.57 inNovember 1981: precipitation 0.83 inNovember 1982: precipitation 4.94 inNovember 2000: precipitation 3.23 in193519802025

Scroll the chart to see all years →

Hover, focus or tap a bar to see its year and value.

Big Meadows, VA station observations, not a park-wide average or forecast. Complete quality-screened calendar months only, separately by metric. Daily high/low means and total precipitation; incomplete months stay null. No interpolation or substitution. Completed years only; separate from 1991-2020 normals.

November access

Typical access through the listed entrances or visitor areas. Check official guidance before you travel.

Approaches and visitor areas Skyline Drive has four vehicle entrances. The road operates year-round, weather permitting, but snow and ice can interrupt travel. Pick an entrance near your planned part of the ridge. Lettered points are the reviewed entrance or access-area locations. They do not mark every road, trail or gate. Front Royal Entrance (North Entrance)A Thornton Gap EntranceB Swift Run Gap EntranceC Rockfish Gap Entrance (South Entrance)DN
  • Park boundary
  • AFront Royal Entrance (North Entrance)
    Open

    Normal road approach, subject to weather and individual site restrictions. This marker is an access location, not a guarantee that every facility is operating.

  • BThornton Gap Entrance
    Open

    Normal road approach, subject to weather and individual site restrictions. This marker is an access location, not a guarantee that every facility is operating.

  • CSwift Run Gap Entrance
    Open

    Normal road approach, subject to weather and individual site restrictions. This marker is an access location, not a guarantee that every facility is operating.

  • DRockfish Gap Entrance (South Entrance)
    Open

    Normal road approach, subject to weather and individual site restrictions. This marker is an access location, not a guarantee that every facility is operating.

November in-park stays

three concessioner lodge/cabin properties, four family campgrounds, Dundo group camping and the separately identified PATC primitive cabins. Normal seasons are planning guidance, not vacancies. Opening/closing months are partial. Unverified means confirm directly. These are normal seasonal schedules, not room or campsite availability.

Frontcountry campground

  • 1Mathews Arm
    Closed

    Outside the normal operating season. Check the published calendar for your dates.

  • 2Big Meadows
    Part month

    The season normally begins or ends during this month. Confirm the dated operating calendar.

  • 3Lewis Mountain
    Part month

    The season normally begins or ends during this month. Confirm the dated operating calendar.

  • 4Loft Mountain
    Closed

    Outside the normal operating season. Check the published calendar for your dates.

Lodge/cabins

  • Skyland
    Part month

    The season normally begins or ends during this month. Confirm the dated operating calendar.

  • Big Meadows Lodge
    Part month

    The season normally begins or ends during this month. Confirm the dated operating calendar.

  • Lewis Mountain Cabins
    Part month

    The season normally begins or ends during this month. Confirm the dated operating calendar.

Separate campground area, confirm use and operating calendar

  • Dundo campground area
    Unverified

    A dependable full-month operating season is not established here. Confirm dates directly before booking.

Supplemental hike-in cabins, separate from road lodging

  • PATC primitive cabins
    Unverified

    A dependable full-month operating season is not established here. Confirm dates directly before booking.

Backcountry trips, permits and specialist travel need separate planning and are outside the frontcountry comparison.

December Lowest 11% of October · 34K avg Harsh 40°F / 24°F (4°C / -5°C) Limitedaccess Limitedlodging Winter ridge weather and reduced stays. Skyline Drive access depends on conditions.Read the December guide

December crowds

34,330 average December visits in 2021–2025.

Monthly recreation visits

47 annual records · 1979–2025

December recreation visits, 1979 to 2025NPS park-wide recreation visits for December in each year. The vertical scale starts at zero. Exact counts follow in the data table. Missing counts are gaps.025k50k1979: 37,355 visits1980: 22,861 visits1981: 23,296 visits1982: 27,221 visits1983: 22,621 visits1984: 38,819 visits1985: 36,511 visits1986: 41,103 visits1987: 33,907 visits1988: 49,698 visits1989: 28,145 visits1990: 34,058 visits1991: 33,834 visits1992: 30,025 visits1993: 24,220 visits1994: 41,269 visits1995: 21,390 visits1996: 33,857 visits1997: 34,033 visits1998: 27,078 visits1999: 26,826 visits2000: 22,520 visits2001: 40,608 visits2002: 16,143 visits2003: 17,550 visits2004: 20,956 visits2005: 4,357 visits2006: 17,064 visits2007: 14,786 visits2008: 17,395 visits2009: 4,752 visits2010: 12,379 visits2011: 22,508 visits2012: 18,034 visits2013: 18,089 visits2014: 21,682 visits2015: 35,149 visits2016: 29,597 visits2017: 25,836 visits2018: 22,826 visits2019: 30,183 visits2020: 44,054 visits2021: 45,939 visits2022: 19,832 visits2023: 39,221 visits2024: 36,544 visits2025: 30,115 visits197919891999200920192025

Scroll the chart to see all years →

Hover, focus or tap a bar to see its year and value.

NPS recreation visits are visits, not unique visitors or a measure of how busy an individual trail feels. Counts can reflect closures, disruptions and changes in counting methods.

December weather

1991 through 2020 averages

Average high
40°F / 4°C
Average low
24°F / -5°C
Monthly precipitation
3.10 in / 79 mm

Big Meadows at about 3,540 ft supplies the ridge temperature normals. The rain normals shown in the table come from Luray 5 E at about 1,400 ft on the valley floor, not the ridge. Snowfall normals are not reported. The historical charts use Big Meadows observations and preserve missing rain data; they do not substitute Luray normals for observations.

December weather through the years at Big Meadows, VA.

Average daily high and low (°F)

39 complete high-temperature records · 27 complete low-temperature records

■ High■ Low

December: Average daily high and low (°F), 1935–2025Only complete calendar months are plotted. Gaps indicate missing or flagged daily observations. Exact values follow in the table.02550December 1936: average high 42.15 °FDecember 1937: average high 36.56 °FDecember 1939: average high 39.88 °FDecember 1941: average high 45.52 °FDecember 1942: average high 33.60 °FDecember 1943: average high 40.91 °FDecember 1945: average high 31.49 °FDecember 1946: average high 45.01 °FDecember 1949: average high 43.17 °FDecember 1950: average high 33.93 °FDecember 1951: average high 41.10 °FDecember 1955: average high 35.99 °FDecember 1956: average high 48.19 °FDecember 1958: average high 33.74 °FDecember 1959: average high 41.66 °FDecember 1960: average high 35.43 °FDecember 1963: average high 27.78 °FDecember 1965: average high 41.87 °FDecember 1967: average high 41.87 °FDecember 1968: average high 34.68 °FDecember 1969: average high 30.82 °FDecember 1970: average high 39.61 °FDecember 1972: average high 43.46 °FDecember 1973: average high 38.07 °FDecember 1974: average high 39.44 °FDecember 1975: average high 38.60 °FDecember 1976: average high 34.36 °FDecember 1977: average high 36.16 °FDecember 1978: average high 40.77 °FDecember 1980: average high 38.99 °FDecember 1981: average high 32.55 °FDecember 1982: average high 44.43 °FDecember 1984: average high 47.88 °FDecember 1985: average high 35.00 °FDecember 1986: average high 39.36 °FDecember 1992: average high 36.95 °FDecember 1994: average high 42.75 °FDecember 2000: average high 30.59 °FDecember 2001: average high 44.55 °FDecember 1935: average low 12.74 °FDecember 1936: average low 25.26 °FDecember 1937: average low 25.17 °FDecember 1939: average low 21.12 °FDecember 1942: average low 17.70 °FDecember 1943: average low 16.75 °FDecember 1945: average low 14.03 °FDecember 1950: average low 18.17 °FDecember 1951: average low 24.88 °FDecember 1960: average low 15.38 °FDecember 1962: average low 14.91 °FDecember 1963: average low 13.36 °FDecember 1964: average low 23.81 °FDecember 1965: average low 26.27 °FDecember 1967: average low 26.25 °FDecember 1968: average low 17.89 °FDecember 1970: average low 22.03 °FDecember 1971: average low 28.78 °FDecember 1972: average low 27.73 °FDecember 1974: average low 24.94 °FDecember 1975: average low 19.85 °FDecember 1976: average low 14.34 °FDecember 1977: average low 19.24 °FDecember 1980: average low 17.45 °FDecember 1981: average low 18.54 °FDecember 1987: average low 21.27 °FDecember 2000: average low 13.34 °F193519802025

Scroll the chart to see all years →

Hover, focus or tap a bar to see its year and value.

Monthly precipitation (inches)

32 complete rain records

December: Monthly precipitation (inches), 1935–2025Only complete calendar months are plotted. Gaps indicate missing or flagged daily observations. Exact values follow in the table.04.59December 1948: precipitation 4.37 inDecember 1949: precipitation 2.57 inDecember 1950: precipitation 8.63 inDecember 1951: precipitation 5.00 inDecember 1952: precipitation 3.82 inDecember 1953: precipitation 4.06 inDecember 1955: precipitation 0.66 inDecember 1956: precipitation 1.78 inDecember 1957: precipitation 6.13 inDecember 1958: precipitation 2.97 inDecember 1959: precipitation 2.41 inDecember 1960: precipitation 1.27 inDecember 1961: precipitation 3.48 inDecember 1962: precipitation 3.64 inDecember 1963: precipitation 1.80 inDecember 1964: precipitation 3.37 inDecember 1965: precipitation 0.51 inDecember 1966: precipitation 3.02 inDecember 1967: precipitation 4.80 inDecember 1968: precipitation 0.86 inDecember 1969: precipitation 6.63 inDecember 1970: precipitation 3.06 inDecember 1971: precipitation 1.31 inDecember 1972: precipitation 4.80 inDecember 1973: precipitation 6.70 inDecember 1975: precipitation 3.11 inDecember 1976: precipitation 2.59 inDecember 1977: precipitation 3.19 inDecember 1978: precipitation 5.54 inDecember 1979: precipitation 2.00 inDecember 1980: precipitation 0.84 inDecember 1981: precipitation 2.27 in193519802025

Scroll the chart to see all years →

Hover, focus or tap a bar to see its year and value.

Big Meadows, VA station observations, not a park-wide average or forecast. Complete quality-screened calendar months only, separately by metric. Daily high/low means and total precipitation; incomplete months stay null. No interpolation or substitution. Completed years only; separate from 1991-2020 normals.

December access

Typical access through the listed entrances or visitor areas. Check official guidance before you travel.

Approaches and visitor areas Skyline Drive has four vehicle entrances. The road operates year-round, weather permitting, but snow and ice can interrupt travel. Pick an entrance near your planned part of the ridge. Lettered points are the reviewed entrance or access-area locations. They do not mark every road, trail or gate. Front Royal Entrance (North Entrance)A Thornton Gap EntranceB Swift Run Gap EntranceC Rockfish Gap Entrance (South Entrance)DN
  • Park boundary
  • AFront Royal Entrance (North Entrance)
    Open

    Normal road approach, subject to weather and individual site restrictions. This marker is an access location, not a guarantee that every facility is operating.

  • BThornton Gap Entrance
    Open

    Normal road approach, subject to weather and individual site restrictions. This marker is an access location, not a guarantee that every facility is operating.

  • CSwift Run Gap Entrance
    Open

    Normal road approach, subject to weather and individual site restrictions. This marker is an access location, not a guarantee that every facility is operating.

  • DRockfish Gap Entrance (South Entrance)
    Open

    Normal road approach, subject to weather and individual site restrictions. This marker is an access location, not a guarantee that every facility is operating.

December in-park stays

three concessioner lodge/cabin properties, four family campgrounds, Dundo group camping and the separately identified PATC primitive cabins. Normal seasons are planning guidance, not vacancies. Opening/closing months are partial. Unverified means confirm directly. These are normal seasonal schedules, not room or campsite availability.

Frontcountry campground

  • 1Mathews Arm
    Closed

    Outside the normal operating season. Check the published calendar for your dates.

  • 2Big Meadows
    Closed

    Outside the normal operating season. Check the published calendar for your dates.

  • 3Lewis Mountain
    Closed

    Outside the normal operating season. Check the published calendar for your dates.

  • 4Loft Mountain
    Closed

    Outside the normal operating season. Check the published calendar for your dates.

Lodge/cabins

  • Skyland
    Closed

    Outside the normal operating season. Check the published calendar for your dates.

  • Big Meadows Lodge
    Closed

    Outside the normal operating season. Check the published calendar for your dates.

  • Lewis Mountain Cabins
    Closed

    Outside the normal operating season. Check the published calendar for your dates.

Separate campground area, confirm use and operating calendar

  • Dundo campground area
    Unverified

    A dependable full-month operating season is not established here. Confirm dates directly before booking.

Supplemental hike-in cabins, separate from road lodging

  • PATC primitive cabins
    Unverified

    A dependable full-month operating season is not established here. Confirm dates directly before booking.

Backcountry trips, permits and specialist travel need separate planning and are outside the frontcountry comparison.

September caveat

September has mild ridge temperatures, broad seasonal stays and fewer average visits than October. The lower daily rate is not explained by the one-day month-length difference. October is the foliage alternative, with far heavier visitation. Rain can occur in either month.

Roads and approaches

Skyline Drive has four vehicle entrances. The road operates year-round, weather permitting, but snow and ice can interrupt travel. Pick an entrance near your planned part of the ridge.

Shenandoah road approaches Skyline Drive has four vehicle entrances. The road operates year-round, weather permitting, but snow and ice can interrupt travel. Pick an entrance near your planned part of the ridge. Lettered points are the reviewed entrance or access-area locations. They do not mark every road, trail or gate. Front Royal Entrance (North Entrance)A Thornton Gap EntranceB Swift Run Gap EntranceC Rockfish Gap Entrance (South Entrance)DN
  • Park boundary
  1. Front Royal Entrance (North Entrance)

    Normal road approach, subject to weather and individual site restrictions. This marker is an access location, not a guarantee that every facility is operating.

  2. Thornton Gap Entrance

    Normal road approach, subject to weather and individual site restrictions. This marker is an access location, not a guarantee that every facility is operating.

  3. Swift Run Gap Entrance

    Normal road approach, subject to weather and individual site restrictions. This marker is an access location, not a guarantee that every facility is operating.

  4. Rockfish Gap Entrance (South Entrance)

    Normal road approach, subject to weather and individual site restrictions. This marker is an access location, not a guarantee that every facility is operating.

Lodging and camping

Skyland, Big Meadows Lodge and Lewis Mountain Cabins have separate seasonal calendars. The four family campgrounds are seasonal. Confirm Dundo separately rather than assuming an operating season. PATC primitive cabins are a separate style of overnight stay.

Shenandoah campground locations Numbered NPS campground points locate the camping areas. Lodges without independently reviewed coordinates remain in the list rather than being placed at guessed locations. Mathews Arm1 Big Meadows2 Lewis Mountain3 Loft Mountain4N
  • Park boundary
  1. Mathews Arm

    Frontcountry campground. Normally April through October. Opening and closing months can be partial. Confirm the dated calendar and your reservation.

  2. Big Meadows

    Frontcountry campground. Normally March through November. Opening and closing months can be partial. Confirm the dated calendar and your reservation.

  3. Lewis Mountain

    Frontcountry campground. Normally March through November. Opening and closing months can be partial. Confirm the dated calendar and your reservation.

  4. Loft Mountain

    Frontcountry campground. Normally April through October. Opening and closing months can be partial. Confirm the dated calendar and your reservation.

  5. Skyland

    Lodge/cabins. Normally March through November. Opening and closing months can be partial. Confirm the dated calendar and your reservation.

  6. Big Meadows Lodge

    Lodge/cabins. Normally May through November. Opening and closing months can be partial. Confirm the dated calendar and your reservation.

  7. Lewis Mountain Cabins

    Lodge/cabins. Normally April through November. Opening and closing months can be partial. Confirm the dated calendar and your reservation.

  8. Dundo campground area

    Separate campground area, confirm use and operating calendar. The official campground page does not establish a dependable normal operating calendar for this area. Do not assume it is an available group-camping option.

  9. PATC primitive cabins

    Supplemental hike-in cabins, separate from road lodging. A dependable monthly operating calendar is not established here. Confirm directly before booking or relying on access.

Staying outside the park

Compare bases near Shenandoah by entrance and season.

Places to stay outside Shenandoah Census internal points locate gateway areas, not hotels or campground buildings. Match the base to the named approach. Front Royal area1 Luray area2 Elkton area3 Waynesboro area4N
  • Park boundary
  1. Front Royal

    Use the northern entrance for the north Skyline Drive district. Snow or ice can interrupt access to the ridge.

  2. Luray

    Use US 211 to Thornton Gap for the central and northern ridge. Choose the base against your itinerary.

  3. Elkton

    Use US 33 to Swift Run Gap for the central/southern ridge.

  4. Waynesboro

    Use Rockfish Gap for the southern end of Skyline Drive. Confirm ridge-road conditions before climbing from the valley.

Hotels or an Airbnb?

Search your dates, group size and entrance.

Hotel or motel
Check price, arrival hours, parking and breakfast.
Cabin or vacation rental
Check location, kitchen, minimum stay, fees and cancellation terms.

Confirm availability before booking.

Which month fits your trip?

Choose your Shenandoah dates around what you want to do. These guides cover the details.

Summer with kids

June for quieter summer days, the accessible Limberlost loop, and the bear, tick, and waterfall rules.

Camping or an RV

Big Meadows books ahead; Lewis Mountain is first-come. Fall weekend sites usually go by early Friday.

Wildlife and photography

Plan Shenandoah by season: May azaleas, June laurel, and a fall color season NPS won't pin to one week.

Spring

Plan seasonal highlights, access, weather and crowds.

Summer

Plan seasonal highlights, access, weather and crowds.

Fall

Plan seasonal highlights, access, weather and crowds.

Winter

Skyline Drive stays open unless snow or ice closes it, and most services shut by late November.

Questions about when to go.

What is the best month to visit Shenandoah?

September is our pick for this trip. September has mild ridge temperatures, broad seasonal stays and fewer average visits than October. The lower daily rate is not explained by the one-day month-length difference. October is the foliage alternative, with far heavier visitation. Rain can occur in either month.

What months are best for Shenandoah?

April through October suit the core trip described here. April has mild daytime ridge normals with cool nights, although some stays open during the month. March has substantially colder days and freezing nights. October stays suitable for layered day walks and autumn views. November approaches freezing at night and properties close through the month.

When is Shenandoah least crowded?

January has the lowest average recreation visits in the 2021–2025 data. Low visits do not establish suitable weather, open roads or an empty trail.

Can you stay inside Shenandoah?

Skyland, Big Meadows Lodge and Lewis Mountain Cabins have separate seasonal calendars. The four family campgrounds are seasonal. Confirm Dundo separately rather than assuming an operating season. PATC primitive cabins are a separate style of overnight stay. Confirm campground seasons and reservation links before booking.

How we built this page.

An independent guide using official data. Not affiliated with or endorsed by the National Park Service.

Crowds
2021–2025 monthly averages. NPS recreation visits, compared with the park’s own busiest month. Visits are not unique visitors or a count of people on a trail.
Weather
1991-2020 climate normals. NOAA’s Big Meadows, VA station. These describe typical weather at the station, not every part of the park or a forecast.
Roads & lodging
Normal seasonal schedules. NPS guidance and official operator information. Confirm access, hours and availability before you travel.
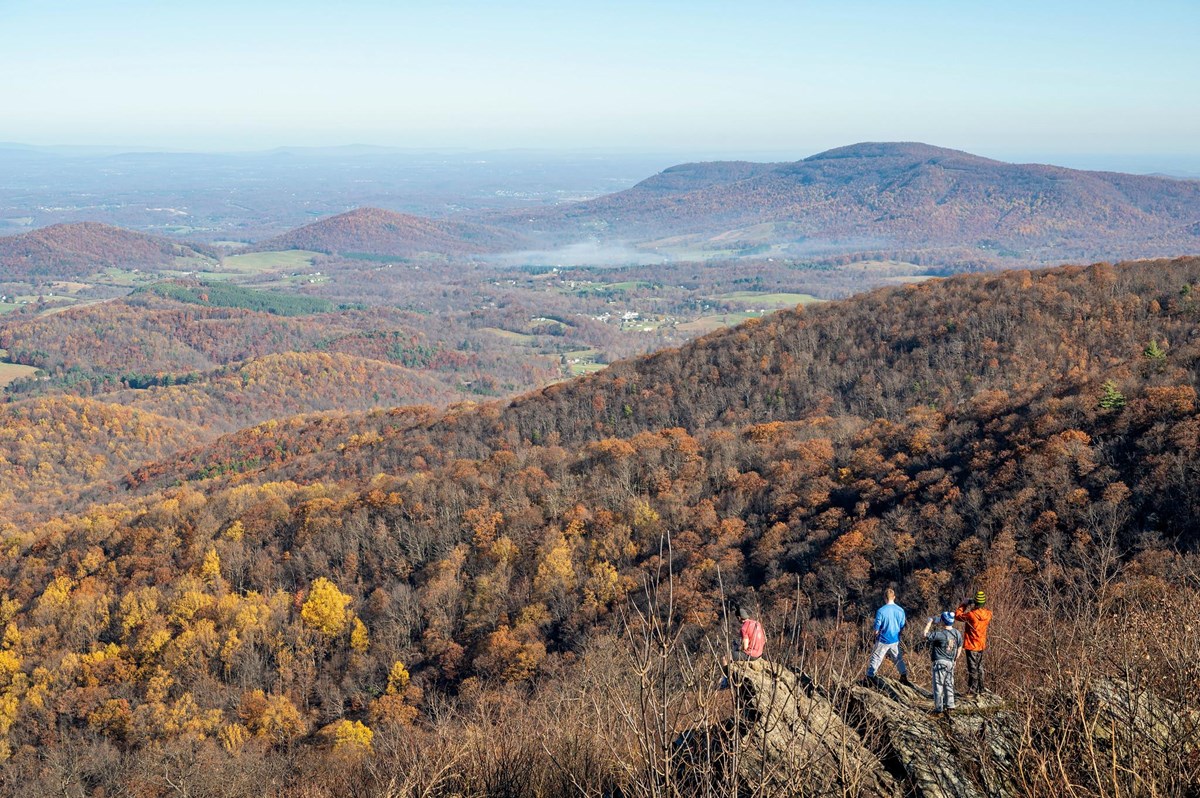
The Almanac Mailing

The next Shenandoah
window, in your inbox.

One email a month. The park to point at, the week to book, the trail that's about to fill up. Unsubscribe in a click.

One email per month. We file your address with care.