Best time to visit
Weigh crowds against typical weather and seasonal access.
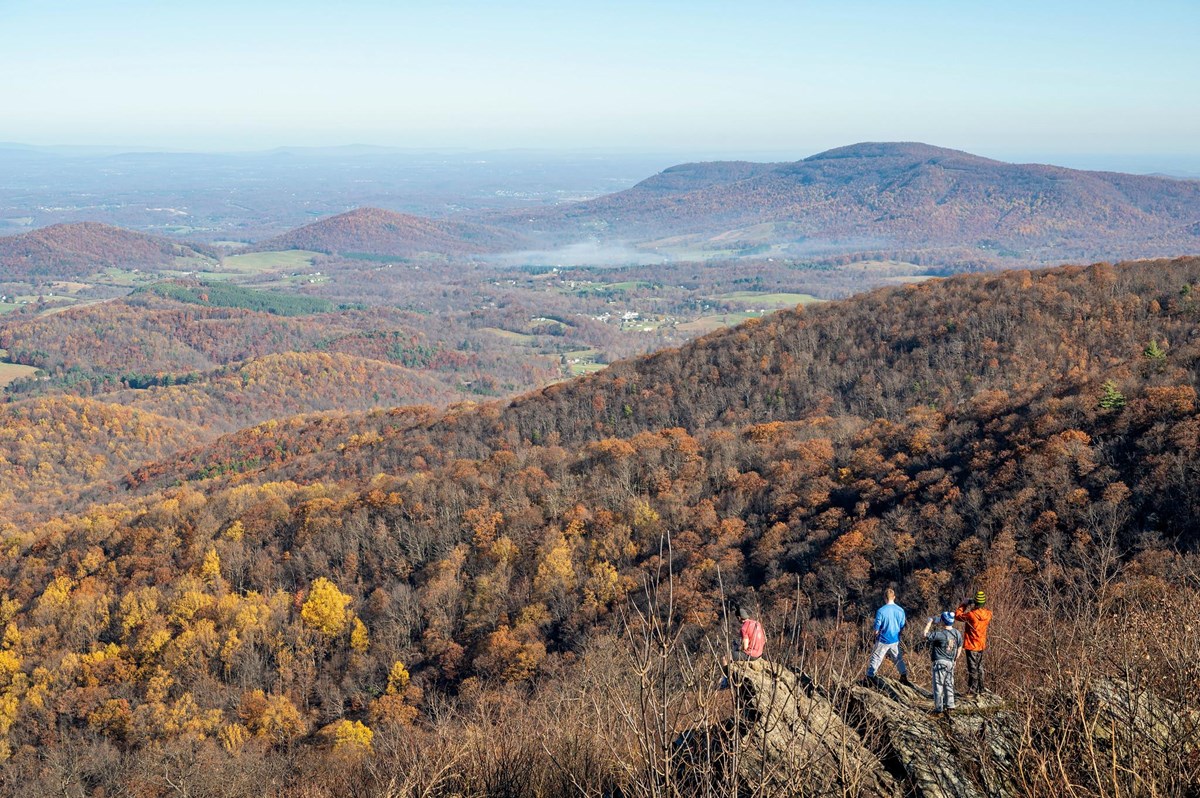
Shenandoah National Park crowds by month are highest in October, averaging 318,584 recreation visits. September averages 52% fewer visits. January has the fewest, averaging 24,259. October’s peak makes the summer months a different comparison from many western parks.
Compare average recreation visits for 2021–2025 alongside typical monthly weather. October is busiest; July and October average 59% and 100% of its peak. The dashed line shows the average month.
| Month | Average visits | Crowd level | Weather |
|---|---|---|---|
| 24,2598% of October peak | Lowest | High / low36°F2°C/19°F-7°C Precipitation2.85 in | |
| 27,6679% of October peak | Lowest | High / low38°F3°C/22°F-6°C Precipitation2.45 in | |
| 74,55823% of October peak | Low | High / low44°F6°C/27°F-3°C Precipitation3.58 in | |
| 126,57640% of October peak | Moderate | High / low57°F14°C/37°F3°C Precipitation3.51 in | |
| 158,25350% of October peak | Moderate | High / low64°F18°C/46°F8°C Precipitation4.21 in | |
| 169,07553% of October peak | Moderate | High / low70°F21°C/54°F12°C Precipitation4.76 in | |
| 186,93159% of October peak | Moderate | High / low75°F24°C/59°F15°C Precipitation4.12 in | |
| 179,43556% of October peak | Moderate | High / low73°F23°C/58°F14°C Precipitation3.77 in | |
| 152,55948% of October peak | Moderate | High / low69°F21°C/52°F11°C Precipitation5.42 in | |
| 318,584100% of October peak | Peak | High / low58°F14°C/42°F5°C Precipitation3.17 in | |
| 151,76948% of October peak | Moderate | High / low48°F9°C/32°F0°C Precipitation3.21 in | |
| 34,33011% of October peak | Low | High / low40°F4°C/24°F-5°C Precipitation3.10 in |
October averages 318,584 recreation visits, the highest monthly average for 2021–2025. These are visits to the reporting unit, not a count of people on a trail.
January has the fewest average recreation visits at 24,259, or 8% of the October peak. Winter’s small totals do not promise access along Skyline Drive or safe conditions for a ridge hike.
July averages 186,931 recreation visits (59% of peak), compared with 318,584 in October (100%). This compares whole months, not a particular weekend or holiday.
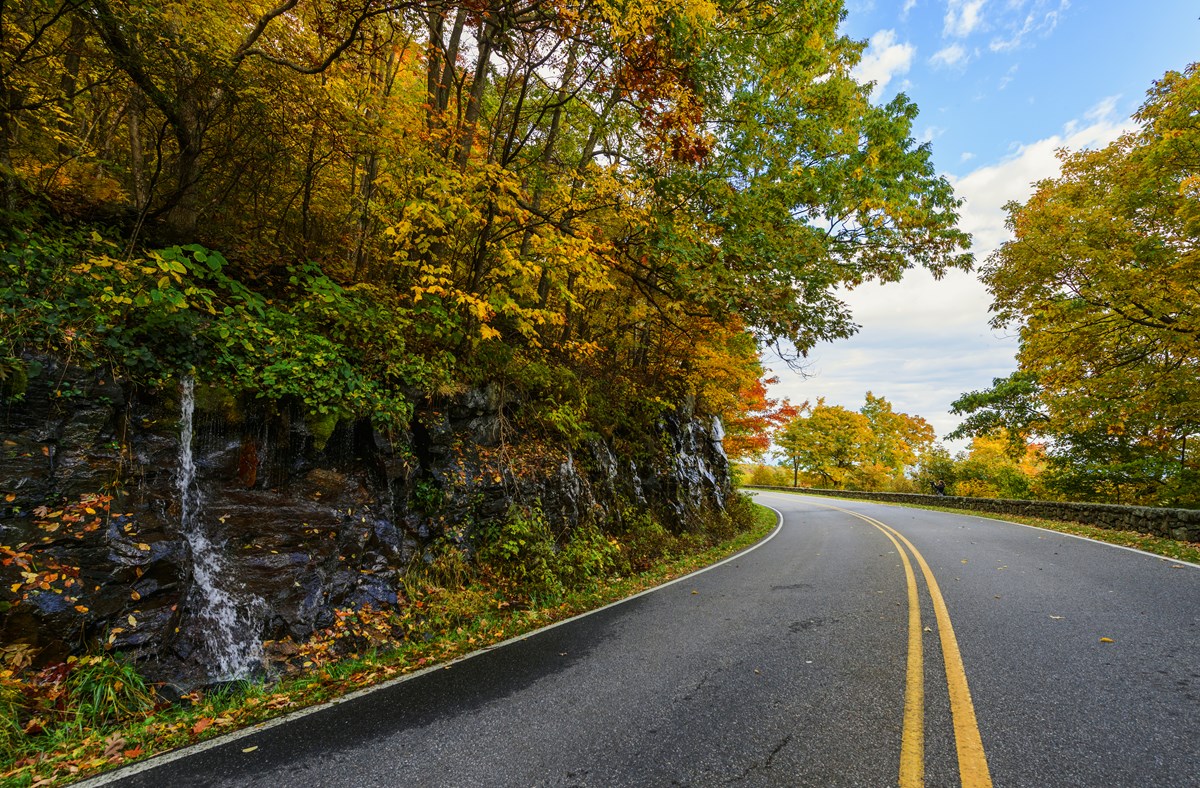
No. Monthly recreation visits show October’s crowd scale, not the timing of leaf color, a particular weekend or traffic at a Skyline Drive overlook. Check the park’s seasonal information separately.
No. Monthly recreation visits do not separate weekdays, weekends, holidays or hours. They cannot predict parking, queues or a quiet trail. Check official arrival information and use the best-time guide to weigh weather and seasonal access.
An independent guide using official data. Not affiliated with or endorsed by the National Park Service.