Best time to visit Acadia

The best time to visit Acadia is May through October.

Selected months from the recommended season.

MeasureMayJulOur pick: SepOct
CrowdsModeratePeakPeakBusy
WeatherGoodGoodGoodMixed
AccessFullFullFullFull
StaysLimitedFullFullLimited

Even though summer and fall are busy, May through October offer milder weather for coastal walks and the Park Loop Road. September is our pick because days are still mild and average visits are 17% less than the peak in August. October is cooler, with campgrounds closing during the month.

National Sites Guide

Share this page

Cite this page

Copy a citation

A couple sits on Cadillac Mountain overlooking the islands and coast at sunset.
Cadillac MountainNPS Photo by Kent Miller
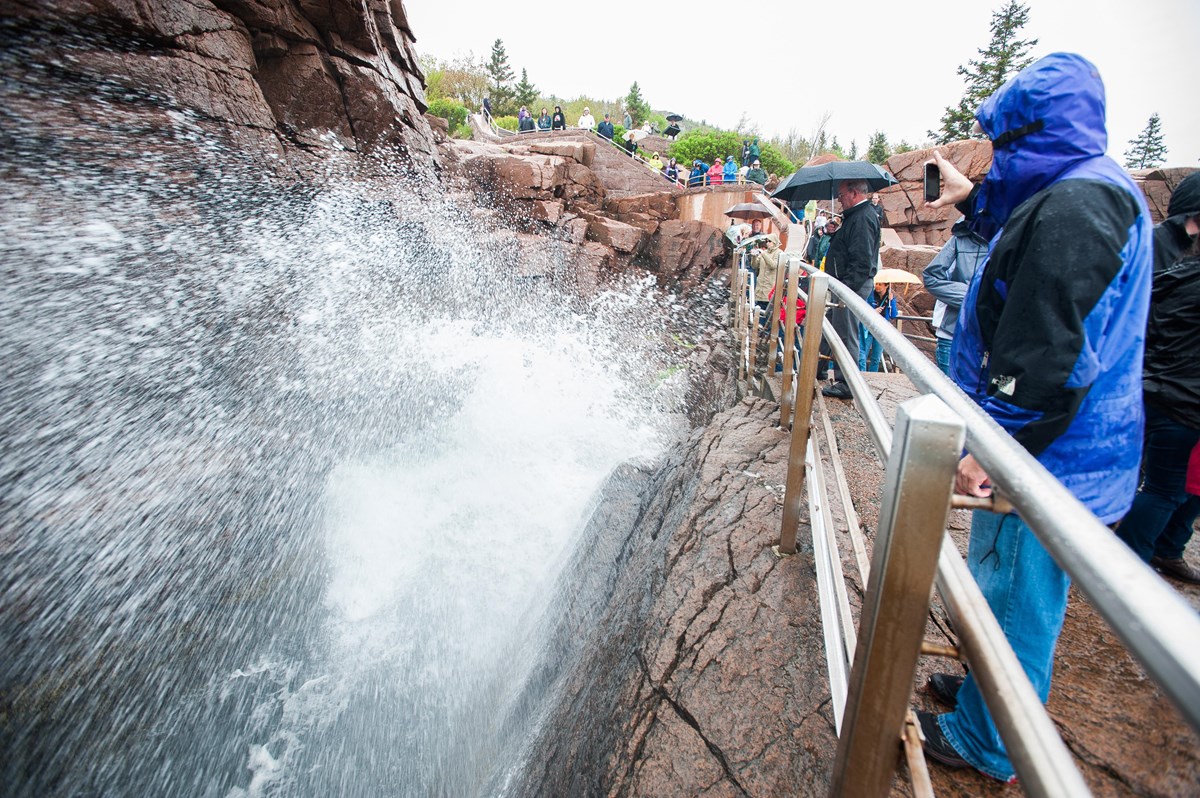
Visitors watch a wave splash against the rocky shore at Thunder Hole.
Thunder HoleNPS Photo by Kent Miller
Cars pass the stone entrance booths on Acadia’s Park Loop Road.
Park Loop Road entranceNPS Photo by Kent Miller

Conditions

Last checked:

  • Eastern Section of Beech Mountain Loop Trail Closed for Repairs Closed · in effect now · nps.gov
  • Schoodic Mountain Road Closed for Repairs Closed · in effect now · nps.gov
  • Southern Section of Ocean Path Closed for Repairs Closed · in effect now · nps.gov

Check before you go

  • Conditions

    NPS

    Check official road, trail and weather information for your destinations.

  • Getting around

    NPS

    Confirm the approach and any seasonal road or transport limits.

  • Overnight plans

    NPS

    Confirm your chosen stay dates, access and reservation directly.

Compare Acadia by month.

Compare Acadia visits, station weather, road approaches and overnight seasons for all twelve months. Read the scope before comparing Access and Stays. Operating seasons are not vacancies.

Month Crowds Weather AccessStays What it means
January Lowest 2% of August · 15K avg Harsh 33°F / 15°F (0°C / -9°C) Limitedaccess Closedlodging Winter road limits and cold weather. There is no winter camping.Read the January guide

January crowds

14,923 average January visits in 2021–2025.

Monthly recreation visits

47 annual records · 1979–2025

January recreation visits, 1979 to 2025NPS park-wide recreation visits for January in each year. The vertical scale starts at zero. Exact counts follow in the data table. Missing counts are gaps.025k50k1979: 6,011 visits1980: 8,966 visits1981: 23,330 visits1982: 21,425 visits1983: 23,771 visits1984: 24,273 visits1985: 31,360 visits1986: 28,369 visits1987: 35,579 visits1988: 43,462 visits1989: 41,114 visits1990: 16,084 visits1991: 24,588 visits1992: 17,510 visits1993: 19,402 visits1994: 13,364 visits1995: 14,894 visits1996: 17,655 visits1997: 16,292 visits1998: 16,726 visits1999: 16,430 visits2000: 22,500 visits2001: 18,090 visits2002: 15,309 visits2003: 22,917 visits2004: 11,861 visits2005: 10,810 visits2006: 13,494 visits2007: 12,415 visits2008: 10,744 visits2009: 9,366 visits2010: 10,510 visits2011: 10,428 visits2012: 11,930 visits2013: 11,249 visits2014: 10,459 visits2015: 12,578 visits2016: 17,204 visits2017: 15,520 visits2018: 11,974 visits2019: 8,532 visits2020: 12,640 visits2021: 20,268 visits2022: 10,411 visits2023: 15,217 visits2024: 15,538 visits2025: 13,183 visits197919891999200920192025

Scroll the chart to see all years →

Hover, focus or tap a bar to see its year and value.

NPS recreation visits are visits, not unique visitors or a measure of how busy an individual trail feels. Counts can reflect closures, disruptions and changes in counting methods.

January weather

1991 through 2020 averages

Average high
33°F / 0°C
Average low
15°F / -9°C
Monthly precipitation
4.48 in / 114 mm

The Acadia NP NOAA station sits at ~470 ft near park headquarters, about 2.5 miles from the NPS API coordinate, so these numbers describe inland Mount Desert Island, not the summits or the open coast. NPS says weather on Cadillac Mountain (1,530 ft) and the other peaks can be very different from Bar Harbor.

January weather through the years at Acadia NP, ME.

Average daily high and low (°F)

14 complete high-temperature records · 13 complete low-temperature records

■ High■ Low

January: Average daily high and low (°F), 1982–2025Only complete calendar months are plotted. Gaps indicate missing or flagged daily observations. Exact values follow in the table.02040January 1984: average high 28.10 °FJanuary 1985: average high 23.87 °FJanuary 1986: average high 32.84 °FJanuary 1988: average high 30.13 °FJanuary 1989: average high 33.72 °FJanuary 1993: average high 32.52 °FJanuary 1994: average high 27.02 °FJanuary 2007: average high 34.19 °FJanuary 2008: average high 35.03 °FJanuary 2009: average high 28.38 °FJanuary 2010: average high 34.68 °FJanuary 2012: average high 36.03 °FJanuary 2013: average high 33.60 °FJanuary 2014: average high 33.19 °FJanuary 1984: average low 10.30 °FJanuary 1985: average low 5.91 °FJanuary 1988: average low 7.31 °FJanuary 1989: average low 14.38 °FJanuary 1992: average low 11.51 °FJanuary 1993: average low 11.63 °FJanuary 1997: average low 9.93 °FJanuary 2006: average low 23.84 °FJanuary 2008: average low 19.31 °FJanuary 2009: average low 8.90 °FJanuary 2010: average low 19.48 °FJanuary 2012: average low 18.06 °FJanuary 2014: average low 14.67 °F198220042025

Scroll the chart to see all years →

Hover, focus or tap a bar to see its year and value.

Monthly precipitation (inches)

9 complete rain records

January: Monthly precipitation (inches), 1982–2025Only complete calendar months are plotted. Gaps indicate missing or flagged daily observations. Exact values follow in the table.03.57January 1994: precipitation 6.17 inJanuary 2006: precipitation 4.60 inJanuary 2007: precipitation 4.62 inJanuary 2008: precipitation 4.78 inJanuary 2009: precipitation 3.19 inJanuary 2010: precipitation 3.28 inJanuary 2012: precipitation 2.84 inJanuary 2013: precipitation 1.32 inJanuary 2014: precipitation 3.31 in198220042025

Scroll the chart to see all years →

Hover, focus or tap a bar to see its year and value.

Acadia NP, ME station observations, not a park-wide average or forecast. Complete quality-screened calendar months only, separately by metric. Daily high/low means and total precipitation; incomplete months stay null. No interpolation or substitution. Completed years only; separate from 1991-2020 normals.

January access

Typical entrance access. Oversnow means winter snowcoach or snowmobile travel, not regular vehicles. Check each entrance’s travel restrictions.

Approaches and visitor areas Acadia has several access points. Mount Desert Island and Schoodic use separate road approaches. Winter vehicle access covers only parts of the Park Loop rather than the complete circuit. Lettered points are the reviewed entrance or access-area locations. They do not mark every road, trail or gate. Park Loop Road Entrance (Route 233)A Sand Beach Entrance StationB Schoodic Entrance (SERC)F year-round access at Schooner Head RoadC Blackwoods Campground Entrance StationD Seawall Campground Entrance StationEN
  • Park boundary
  • APark Loop Road Entrance (Route 233)
    Oversnow

    Most of the Park Loop has a winter vehicle closure. The limited winter sections are a different route.

  • BSand Beach Entrance Station
    Open

    Normal road approach, subject to weather and individual site restrictions. This marker is an access location, not a guarantee that every facility is operating.

  • Cyear-round access at Schooner Head Road
    Open

    Normal road approach, subject to weather and individual site restrictions. This marker is an access location, not a guarantee that every facility is operating.

  • DBlackwoods Campground Entrance Station
    Closed

    Campground approach follows the camping season. Outside the normal operating season. Check the published calendar for your dates.

  • ESeawall Campground Entrance Station
    Closed

    Campground approach follows the camping season. Outside the normal operating season. Check the published calendar for your dates.

  • FSchoodic Entrance (SERC)
    Open

    Normal road approach, subject to weather and individual site restrictions. This marker is an access location, not a guarantee that every facility is operating.

January in-park stays

the three road-access campgrounds, Duck Harbor lean-tos and the stock-only Wildwood Stables campground; there is no park lodge. Normal seasons are planning guidance, not vacancies. Opening/closing months are partial. Unverified means confirm directly. These are normal seasonal schedules, not room or campsite availability.

Frontcountry campground

  • 1Blackwoods
    Closed

    Outside the normal operating season. Check the published calendar for your dates.

  • 2Seawall
    Closed

    Outside the normal operating season. Check the published calendar for your dates.

  • 3Schoodic Woods
    Closed

    Outside the normal operating season. Check the published calendar for your dates.

Walk-in island shelters

  • 4Duck Harbor
    Closed

    Outside the normal operating season. Check the published calendar for your dates.

Stock-only campground

  • Wildwood Stables
    Closed

    Outside the normal operating season. Check the published calendar for your dates.

NPS does not allow backcountry or winter camping. Duck Harbor shelters and stock-only Wildwood camping are identified separately.

February Lowest 2% of August · 14K avg Harsh 35°F / 18°F (2°C / -8°C) Limitedaccess Closedlodging The lowest average visits, with winter road limits and no park camping.Read the February guide

February crowds

13,774 average February visits in 2021–2025.

Monthly recreation visits

47 annual records · 1979–2025

February recreation visits, 1979 to 2025NPS park-wide recreation visits for February in each year. The vertical scale starts at zero. Exact counts follow in the data table. Missing counts are gaps.025k50k1979: 5,243 visits1980: 8,225 visits1981: 16,207 visits1982: 22,210 visits1983: 24,667 visits1984: 26,185 visits1985: 23,261 visits1986: 33,055 visits1987: 35,766 visits1988: 30,060 visits1989: 42,012 visits1990: 13,383 visits1991: 14,667 visits1992: 21,110 visits1993: 15,556 visits1994: 18,112 visits1995: 20,510 visits1996: 15,576 visits1997: 17,230 visits1998: 17,028 visits1999: 17,162 visits2000: 23,848 visits2001: 23,926 visits2002: 25,071 visits2003: 21,993 visits2004: 14,266 visits2005: 11,831 visits2006: 12,924 visits2007: 11,068 visits2008: 11,131 visits2009: 9,751 visits2010: 13,398 visits2011: 9,533 visits2012: 12,388 visits2013: 9,869 visits2014: 10,258 visits2015: 10,626 visits2016: 16,530 visits2017: 14,342 visits2018: 12,167 visits2019: 9,154 visits2020: 13,459 visits2021: 16,123 visits2022: 13,045 visits2023: 15,281 visits2024: 14,071 visits2025: 10,352 visits197919891999200920192025

Scroll the chart to see all years →

Hover, focus or tap a bar to see its year and value.

NPS recreation visits are visits, not unique visitors or a measure of how busy an individual trail feels. Counts can reflect closures, disruptions and changes in counting methods.

February weather

1991 through 2020 averages

Average high
35°F / 2°C
Average low
18°F / -8°C
Monthly precipitation
3.84 in / 98 mm

The Acadia NP NOAA station sits at ~470 ft near park headquarters, about 2.5 miles from the NPS API coordinate, so these numbers describe inland Mount Desert Island, not the summits or the open coast. NPS says weather on Cadillac Mountain (1,530 ft) and the other peaks can be very different from Bar Harbor.

February weather through the years at Acadia NP, ME.

Average daily high and low (°F)

20 complete high-temperature records · 18 complete low-temperature records

■ High■ Low

February: Average daily high and low (°F), 1982–2025Only complete calendar months are plotted. Gaps indicate missing or flagged daily observations. Exact values follow in the table.02040February 1984: average high 38.93 °FFebruary 1985: average high 34.12 °FFebruary 1986: average high 30.04 °FFebruary 1987: average high 29.13 °FFebruary 1988: average high 35.46 °FFebruary 1989: average high 30.76 °FFebruary 1992: average high 34.23 °FFebruary 1993: average high 28.07 °FFebruary 1994: average high 31.25 °FFebruary 1995: average high 32.10 °FFebruary 1996: average high 33.24 °FFebruary 1998: average high 38.34 °FFebruary 2006: average high 33.58 °FFebruary 2007: average high 29.42 °FFebruary 2008: average high 36.15 °FFebruary 2010: average high 36.80 °FFebruary 2011: average high 34.28 °FFebruary 2012: average high 37.85 °FFebruary 2013: average high 35.70 °FFebruary 2014: average high 32.93 °FFebruary 1984: average low 21.44 °FFebruary 1986: average low 10.42 °FFebruary 1987: average low 9.08 °FFebruary 1989: average low 12.82 °FFebruary 1992: average low 13.81 °FFebruary 1993: average low 3.81 °FFebruary 1994: average low 10.17 °FFebruary 1997: average low 16.85 °FFebruary 1998: average low 21.78 °FFebruary 1999: average low 18.99 °FFebruary 2006: average low 17.80 °FFebruary 2007: average low 10.97 °FFebruary 2008: average low 19.42 °FFebruary 2010: average low 22.43 °FFebruary 2011: average low 16.42 °FFebruary 2012: average low 20.93 °FFebruary 2013: average low 20.47 °FFebruary 2014: average low 17.21 °F198220042025

Scroll the chart to see all years →

Hover, focus or tap a bar to see its year and value.

Monthly precipitation (inches)

11 complete rain records

February: Monthly precipitation (inches), 1982–2025Only complete calendar months are plotted. Gaps indicate missing or flagged daily observations. Exact values follow in the table.0510February 1993: precipitation 5.81 inFebruary 1996: precipitation 3.57 inFebruary 2006: precipitation 3.59 inFebruary 2007: precipitation 3.12 inFebruary 2008: precipitation 9.13 inFebruary 2009: precipitation 1.92 inFebruary 2010: precipitation 3.63 inFebruary 2011: precipitation 2.78 inFebruary 2012: precipitation 2.24 inFebruary 2013: precipitation 2.93 inFebruary 2014: precipitation 2.93 in198220042025

Scroll the chart to see all years →

Hover, focus or tap a bar to see its year and value.

Acadia NP, ME station observations, not a park-wide average or forecast. Complete quality-screened calendar months only, separately by metric. Daily high/low means and total precipitation; incomplete months stay null. No interpolation or substitution. Completed years only; separate from 1991-2020 normals.

February access

Typical entrance access. Oversnow means winter snowcoach or snowmobile travel, not regular vehicles. Check each entrance’s travel restrictions.

Approaches and visitor areas Acadia has several access points. Mount Desert Island and Schoodic use separate road approaches. Winter vehicle access covers only parts of the Park Loop rather than the complete circuit. Lettered points are the reviewed entrance or access-area locations. They do not mark every road, trail or gate. Park Loop Road Entrance (Route 233)A Sand Beach Entrance StationB Schoodic Entrance (SERC)F year-round access at Schooner Head RoadC Blackwoods Campground Entrance StationD Seawall Campground Entrance StationEN
  • Park boundary
  • APark Loop Road Entrance (Route 233)
    Oversnow

    Most of the Park Loop has a winter vehicle closure. The limited winter sections are a different route.

  • BSand Beach Entrance Station
    Open

    Normal road approach, subject to weather and individual site restrictions. This marker is an access location, not a guarantee that every facility is operating.

  • Cyear-round access at Schooner Head Road
    Open

    Normal road approach, subject to weather and individual site restrictions. This marker is an access location, not a guarantee that every facility is operating.

  • DBlackwoods Campground Entrance Station
    Closed

    Campground approach follows the camping season. Outside the normal operating season. Check the published calendar for your dates.

  • ESeawall Campground Entrance Station
    Closed

    Campground approach follows the camping season. Outside the normal operating season. Check the published calendar for your dates.

  • FSchoodic Entrance (SERC)
    Open

    Normal road approach, subject to weather and individual site restrictions. This marker is an access location, not a guarantee that every facility is operating.

February in-park stays

the three road-access campgrounds, Duck Harbor lean-tos and the stock-only Wildwood Stables campground; there is no park lodge. Normal seasons are planning guidance, not vacancies. Opening/closing months are partial. Unverified means confirm directly. These are normal seasonal schedules, not room or campsite availability.

Frontcountry campground

  • 1Blackwoods
    Closed

    Outside the normal operating season. Check the published calendar for your dates.

  • 2Seawall
    Closed

    Outside the normal operating season. Check the published calendar for your dates.

  • 3Schoodic Woods
    Closed

    Outside the normal operating season. Check the published calendar for your dates.

Walk-in island shelters

  • 4Duck Harbor
    Closed

    Outside the normal operating season. Check the published calendar for your dates.

Stock-only campground

  • Wildwood Stables
    Closed

    Outside the normal operating season. Check the published calendar for your dates.

NPS does not allow backcountry or winter camping. Duck Harbor shelters and stock-only Wildwood camping are identified separately.

March Lowest 4% of August · 29K avg Harsh 42°F / 25°F (5°C / -4°C) Limitedaccess Closedlodging Cold nights and winter vehicle limits still shape the trip.Read the March guide

March crowds

28,611 average March visits in 2021–2025.

Monthly recreation visits

47 annual records · 1979–2025

March recreation visits, 1979 to 2025NPS park-wide recreation visits for March in each year. The vertical scale starts at zero. Exact counts follow in the data table. Missing counts are gaps.050k100k1979: 11,165 visits1980: 7,505 visits1981: 21,923 visits1982: 36,866 visits1983: 25,576 visits1984: 37,289 visits1985: 46,315 visits1986: 47,390 visits1987: 56,924 visits1988: 54,253 visits1989: 74,773 visits1990: 30,060 visits1991: 31,291 visits1992: 30,312 visits1993: 29,040 visits1994: 29,086 visits1995: 32,120 visits1996: 32,452 visits1997: 27,035 visits1998: 27,500 visits1999: 33,688 visits2000: 35,423 visits2001: 35,473 visits2002: 34,498 visits2003: 34,274 visits2004: 20,952 visits2005: 18,917 visits2006: 21,695 visits2007: 19,220 visits2008: 17,489 visits2009: 19,258 visits2010: 26,080 visits2011: 19,510 visits2012: 22,684 visits2013: 20,631 visits2014: 17,502 visits2015: 18,062 visits2016: 28,121 visits2017: 20,936 visits2018: 23,756 visits2019: 20,161 visits2020: 28,539 visits2021: 38,060 visits2022: 22,476 visits2023: 30,822 visits2024: 25,696 visits2025: 26,000 visits197919891999200920192025

Scroll the chart to see all years →

Hover, focus or tap a bar to see its year and value.

NPS recreation visits are visits, not unique visitors or a measure of how busy an individual trail feels. Counts can reflect closures, disruptions and changes in counting methods.

March weather

1991 through 2020 averages

Average high
42°F / 5°C
Average low
25°F / -4°C
Monthly precipitation
4.94 in / 125 mm

The Acadia NP NOAA station sits at ~470 ft near park headquarters, about 2.5 miles from the NPS API coordinate, so these numbers describe inland Mount Desert Island, not the summits or the open coast. NPS says weather on Cadillac Mountain (1,530 ft) and the other peaks can be very different from Bar Harbor.

March weather through the years at Acadia NP, ME.

Average daily high and low (°F)

20 complete high-temperature records · 23 complete low-temperature records

■ High■ Low

March: Average daily high and low (°F), 1982–2025Only complete calendar months are plotted. Gaps indicate missing or flagged daily observations. Exact values follow in the table.02550March 1983: average high 40.99 °FMarch 1984: average high 34.77 °FMarch 1985: average high 41.48 °FMarch 1986: average high 41.19 °FMarch 1987: average high 38.81 °FMarch 1988: average high 39.58 °FMarch 1989: average high 37.93 °FMarch 1992: average high 38.16 °FMarch 1994: average high 41.19 °FMarch 1995: average high 40.97 °FMarch 1996: average high 41.49 °FMarch 1997: average high 38.64 °FMarch 2005: average high 39.99 °FMarch 2007: average high 42.70 °FMarch 2008: average high 38.39 °FMarch 2010: average high 49.22 °FMarch 2011: average high 42.39 °FMarch 2012: average high 48.71 °FMarch 2013: average high 42.06 °FMarch 2014: average high 37.56 °FMarch 1983: average low 25.97 °FMarch 1984: average low 16.21 °FMarch 1985: average low 21.17 °FMarch 1986: average low 21.47 °FMarch 1987: average low 22.92 °FMarch 1989: average low 20.10 °FMarch 1993: average low 19.23 °FMarch 1994: average low 22.36 °FMarch 1995: average low 24.16 °FMarch 1996: average low 20.40 °FMarch 1997: average low 19.19 °FMarch 2000: average low 27.89 °FMarch 2002: average low 23.92 °FMarch 2003: average low 22.89 °FMarch 2005: average low 23.26 °FMarch 2007: average low 23.83 °FMarch 2008: average low 23.36 °FMarch 2009: average low 24.04 °FMarch 2010: average low 31.55 °FMarch 2011: average low 25.05 °FMarch 2012: average low 30.58 °FMarch 2013: average low 27.36 °FMarch 2014: average low 19.03 °F198220042025

Scroll the chart to see all years →

Hover, focus or tap a bar to see its year and value.

Monthly precipitation (inches)

12 complete rain records

March: Monthly precipitation (inches), 1982–2025Only complete calendar months are plotted. Gaps indicate missing or flagged daily observations. Exact values follow in the table.04.59March 1993: precipitation 6.57 inMarch 1996: precipitation 4.49 inMarch 2002: precipitation 6.80 inMarch 2006: precipitation 1.64 inMarch 2007: precipitation 6.34 inMarch 2008: precipitation 8.10 inMarch 2009: precipitation 2.46 inMarch 2010: precipitation 8.90 inMarch 2011: precipitation 5.57 inMarch 2012: precipitation 2.12 inMarch 2013: precipitation 2.97 inMarch 2014: precipitation 4.06 in198220042025

Scroll the chart to see all years →

Hover, focus or tap a bar to see its year and value.

Acadia NP, ME station observations, not a park-wide average or forecast. Complete quality-screened calendar months only, separately by metric. Daily high/low means and total precipitation; incomplete months stay null. No interpolation or substitution. Completed years only; separate from 1991-2020 normals.

March access

Typical entrance access. Oversnow means winter snowcoach or snowmobile travel, not regular vehicles. Check each entrance’s travel restrictions.

Approaches and visitor areas Acadia has several access points. Mount Desert Island and Schoodic use separate road approaches. Winter vehicle access covers only parts of the Park Loop rather than the complete circuit. Lettered points are the reviewed entrance or access-area locations. They do not mark every road, trail or gate. Park Loop Road Entrance (Route 233)A Sand Beach Entrance StationB Schoodic Entrance (SERC)F year-round access at Schooner Head RoadC Blackwoods Campground Entrance StationD Seawall Campground Entrance StationEN
  • Park boundary
  • APark Loop Road Entrance (Route 233)
    Oversnow

    Most of the Park Loop has a winter vehicle closure. The limited winter sections are a different route.

  • BSand Beach Entrance Station
    Open

    Normal road approach, subject to weather and individual site restrictions. This marker is an access location, not a guarantee that every facility is operating.

  • Cyear-round access at Schooner Head Road
    Open

    Normal road approach, subject to weather and individual site restrictions. This marker is an access location, not a guarantee that every facility is operating.

  • DBlackwoods Campground Entrance Station
    Closed

    Campground approach follows the camping season. Outside the normal operating season. Check the published calendar for your dates.

  • ESeawall Campground Entrance Station
    Closed

    Campground approach follows the camping season. Outside the normal operating season. Check the published calendar for your dates.

  • FSchoodic Entrance (SERC)
    Open

    Normal road approach, subject to weather and individual site restrictions. This marker is an access location, not a guarantee that every facility is operating.

March in-park stays

the three road-access campgrounds, Duck Harbor lean-tos and the stock-only Wildwood Stables campground; there is no park lodge. Normal seasons are planning guidance, not vacancies. Opening/closing months are partial. Unverified means confirm directly. These are normal seasonal schedules, not room or campsite availability.

Frontcountry campground

  • 1Blackwoods
    Closed

    Outside the normal operating season. Check the published calendar for your dates.

  • 2Seawall
    Closed

    Outside the normal operating season. Check the published calendar for your dates.

  • 3Schoodic Woods
    Closed

    Outside the normal operating season. Check the published calendar for your dates.

Walk-in island shelters

  • 4Duck Harbor
    Closed

    Outside the normal operating season. Check the published calendar for your dates.

Stock-only campground

  • Wildwood Stables
    Closed

    Outside the normal operating season. Check the published calendar for your dates.

NPS does not allow backcountry or winter camping. Duck Harbor shelters and stock-only Wildwood camping are identified separately.

April Lowest 13% of August · 102K avg Mixed 53°F / 35°F (12°C / 2°C) Limitedaccess Closedlodging The Park Loop normally opens during April. Plan for cold nights and a partial road month.Read the April guide

April crowds

101,703 average April visits in 2021–2025.

Monthly recreation visits

47 annual records · 1979–2025

April recreation visits, 1979 to 2025NPS park-wide recreation visits for April in each year. The vertical scale starts at zero. Exact counts follow in the data table. Missing counts are gaps.0175k350k1979: 219,351 visits1980: 182,879 visits1981: 188,071 visits1982: 193,208 visits1983: 207,347 visits1984: 229,638 visits1985: 261,410 visits1986: 257,926 visits1987: 292,358 visits1988: 223,653 visits1989: 324,714 visits1990: 17,898 visits1991: 75,738 visits1992: 63,276 visits1993: 57,707 visits1994: 58,788 visits1995: 86,198 visits1996: 76,597 visits1997: 77,005 visits1998: 81,896 visits1999: 82,993 visits2000: 78,555 visits2001: 76,007 visits2002: 72,528 visits2003: 68,444 visits2004: 60,180 visits2005: 59,773 visits2006: 59,034 visits2007: 61,775 visits2008: 53,798 visits2009: 59,277 visits2010: 57,992 visits2011: 58,307 visits2012: 59,471 visits2013: 47,090 visits2014: 57,211 visits2015: 63,214 visits2016: 94,199 visits2017: 85,267 visits2018: 72,858 visits2019: 68,046 visits2020: 55,713 visits2021: 110,096 visits2022: 105,126 visits2023: 102,928 visits2024: 95,165 visits2025: 95,200 visits197919891999200920192025

Scroll the chart to see all years →

Hover, focus or tap a bar to see its year and value.

NPS recreation visits are visits, not unique visitors or a measure of how busy an individual trail feels. Counts can reflect closures, disruptions and changes in counting methods.

April weather

1991 through 2020 averages

Average high
53°F / 12°C
Average low
35°F / 2°C
Monthly precipitation
5.15 in / 131 mm

The Acadia NP NOAA station sits at ~470 ft near park headquarters, about 2.5 miles from the NPS API coordinate, so these numbers describe inland Mount Desert Island, not the summits or the open coast. NPS says weather on Cadillac Mountain (1,530 ft) and the other peaks can be very different from Bar Harbor.

April weather through the years at Acadia NP, ME.

Average daily high and low (°F)

15 complete high-temperature records · 19 complete low-temperature records

■ High■ Low

April: Average daily high and low (°F), 1982–2025Only complete calendar months are plotted. Gaps indicate missing or flagged daily observations. Exact values follow in the table.03060April 1983: average high 51.30 °FApril 1984: average high 51.61 °FApril 1985: average high 53.73 °FApril 1986: average high 55.26 °FApril 1987: average high 53.28 °FApril 1988: average high 51.45 °FApril 1991: average high 56.64 °FApril 1992: average high 49.47 °FApril 1996: average high 52.06 °FApril 1999: average high 56.17 °FApril 2009: average high 55.07 °FApril 2010: average high 58.67 °FApril 2012: average high 56.29 °FApril 2013: average high 53.43 °FApril 2014: average high 52.70 °FApril 1987: average low 34.38 °FApril 1988: average low 32.83 °FApril 1991: average low 34.10 °FApril 1993: average low 32.77 °FApril 1994: average low 32.06 °FApril 1995: average low 29.65 °FApril 1996: average low 32.52 °FApril 1998: average low 34.47 °FApril 1999: average low 33.86 °FApril 2001: average low 31.23 °FApril 2002: average low 33.36 °FApril 2004: average low 34.84 °FApril 2006: average low 37.65 °FApril 2008: average low 36.43 °FApril 2009: average low 35.76 °FApril 2010: average low 39.30 °FApril 2012: average low 36.42 °FApril 2013: average low 35.07 °FApril 2014: average low 34.00 °F198220042025

Scroll the chart to see all years →

Hover, focus or tap a bar to see its year and value.

Monthly precipitation (inches)

7 complete rain records

April: Monthly precipitation (inches), 1982–2025Only complete calendar months are plotted. Gaps indicate missing or flagged daily observations. Exact values follow in the table.03.57April 2006: precipitation 3.22 inApril 2008: precipitation 4.19 inApril 2009: precipitation 4.85 inApril 2010: precipitation 1.89 inApril 2012: precipitation 5.33 inApril 2013: precipitation 3.85 inApril 2014: precipitation 6.11 in198220042025

Scroll the chart to see all years →

Hover, focus or tap a bar to see its year and value.

Acadia NP, ME station observations, not a park-wide average or forecast. Complete quality-screened calendar months only, separately by metric. Daily high/low means and total precipitation; incomplete months stay null. No interpolation or substitution. Completed years only; separate from 1991-2020 normals.

April access

Typical entrance access. Oversnow means winter snowcoach or snowmobile travel, not regular vehicles. Check each entrance’s travel restrictions.

Approaches and visitor areas Acadia has several access points. Mount Desert Island and Schoodic use separate road approaches. Winter vehicle access covers only parts of the Park Loop rather than the complete circuit. Lettered points are the reviewed entrance or access-area locations. They do not mark every road, trail or gate. Park Loop Road Entrance (Route 233)A Sand Beach Entrance StationB Schoodic Entrance (SERC)F year-round access at Schooner Head RoadC Blackwoods Campground Entrance StationD Seawall Campground Entrance StationEN
  • Park boundary
  • APark Loop Road Entrance (Route 233)
    Part month

    The normal paved-road season begins during April, weather permitting.

  • BSand Beach Entrance Station
    Open

    Normal road approach, subject to weather and individual site restrictions. This marker is an access location, not a guarantee that every facility is operating.

  • Cyear-round access at Schooner Head Road
    Open

    Normal road approach, subject to weather and individual site restrictions. This marker is an access location, not a guarantee that every facility is operating.

  • DBlackwoods Campground Entrance Station
    Closed

    Campground approach follows the camping season. Outside the normal operating season. Check the published calendar for your dates.

  • ESeawall Campground Entrance Station
    Closed

    Campground approach follows the camping season. Outside the normal operating season. Check the published calendar for your dates.

  • FSchoodic Entrance (SERC)
    Open

    Normal road approach, subject to weather and individual site restrictions. This marker is an access location, not a guarantee that every facility is operating.

April in-park stays

the three road-access campgrounds, Duck Harbor lean-tos and the stock-only Wildwood Stables campground; there is no park lodge. Normal seasons are planning guidance, not vacancies. Opening/closing months are partial. Unverified means confirm directly. These are normal seasonal schedules, not room or campsite availability.

Frontcountry campground

  • 1Blackwoods
    Closed

    Outside the normal operating season. Check the published calendar for your dates.

  • 2Seawall
    Closed

    Outside the normal operating season. Check the published calendar for your dates.

  • 3Schoodic Woods
    Closed

    Outside the normal operating season. Check the published calendar for your dates.

Walk-in island shelters

  • 4Duck Harbor
    Closed

    Outside the normal operating season. Check the published calendar for your dates.

Stock-only campground

  • Wildwood Stables
    Closed

    Outside the normal operating season. Check the published calendar for your dates.

NPS does not allow backcountry or winter camping. Duck Harbor shelters and stock-only Wildwood camping are identified separately.

May Moderate 41% of August · 327K avg Good 65°F / 45°F (18°C / 7°C)
Full
access
Limitedlodging Milder daytime walks. Some campgrounds open during May.Read the May guide

May crowds

327,335 average May visits in 2021–2025.

Monthly recreation visits

47 annual records · 1979–2025

May recreation visits, 1979 to 2025NPS park-wide recreation visits for May in each year. The vertical scale starts at zero. Exact counts follow in the data table. Missing counts are gaps.0300k600k1979: 339,416 visits1980: 209,301 visits1981: 212,500 visits1982: 261,452 visits1983: 287,861 visits1984: 271,964 visits1985: 341,775 visits1986: 411,604 visits1987: 444,265 visits1988: 448,299 visits1989: 579,272 visits1990: 148,090 visits1991: 157,252 visits1992: 164,400 visits1993: 192,823 visits1994: 182,781 visits1995: 175,550 visits1996: 166,290 visits1997: 132,194 visits1998: 148,052 visits1999: 174,610 visits2000: 166,456 visits2001: 157,353 visits2002: 163,145 visits2003: 135,443 visits2004: 134,597 visits2005: 110,330 visits2006: 120,889 visits2007: 132,152 visits2008: 125,679 visits2009: 129,885 visits2010: 169,898 visits2011: 132,720 visits2012: 157,406 visits2013: 133,653 visits2014: 153,013 visits2015: 187,205 visits2016: 217,147 visits2017: 222,978 visits2018: 249,050 visits2019: 226,156 visits2020: 103,120 visits2021: 324,654 visits2022: 327,466 visits2023: 340,425 visits2024: 320,885 visits2025: 323,243 visits197919891999200920192025

Scroll the chart to see all years →

Hover, focus or tap a bar to see its year and value.

NPS recreation visits are visits, not unique visitors or a measure of how busy an individual trail feels. Counts can reflect closures, disruptions and changes in counting methods.

May weather

1991 through 2020 averages

Average high
65°F / 18°C
Average low
45°F / 7°C
Monthly precipitation
4.50 in / 114 mm

The Acadia NP NOAA station sits at ~470 ft near park headquarters, about 2.5 miles from the NPS API coordinate, so these numbers describe inland Mount Desert Island, not the summits or the open coast. NPS says weather on Cadillac Mountain (1,530 ft) and the other peaks can be very different from Bar Harbor.

May weather through the years at Acadia NP, ME.

Average daily high and low (°F)

14 complete high-temperature records · 21 complete low-temperature records

■ High■ Low

May: Average daily high and low (°F), 1982–2025Only complete calendar months are plotted. Gaps indicate missing or flagged daily observations. Exact values follow in the table.04080May 1984: average high 63.45 °FMay 1986: average high 62.88 °FMay 1992: average high 66.23 °FMay 1996: average high 63.23 °FMay 1997: average high 60.52 °FMay 1998: average high 70.80 °FMay 2006: average high 64.32 °FMay 2007: average high 64.50 °FMay 2009: average high 65.15 °FMay 2010: average high 68.90 °FMay 2011: average high 61.20 °FMay 2012: average high 65.90 °FMay 2013: average high 63.59 °FMay 2014: average high 62.29 °FMay 1985: average low 39.54 °FMay 1986: average low 41.83 °FMay 1987: average low 40.81 °FMay 1991: average low 44.36 °FMay 1992: average low 40.49 °FMay 1993: average low 42.46 °FMay 1994: average low 40.75 °FMay 1995: average low 40.62 °FMay 1996: average low 40.53 °FMay 1997: average low 39.99 °FMay 2001: average low 42.33 °FMay 2004: average low 44.47 °FMay 2005: average low 40.34 °FMay 2006: average low 46.89 °FMay 2007: average low 44.13 °FMay 2008: average low 44.10 °FMay 2009: average low 46.66 °FMay 2010: average low 48.49 °FMay 2011: average low 45.90 °FMay 2013: average low 45.25 °FMay 2014: average low 44.81 °F198220042025

Scroll the chart to see all years →

Hover, focus or tap a bar to see its year and value.

Monthly precipitation (inches)

10 complete rain records

May: Monthly precipitation (inches), 1982–2025Only complete calendar months are plotted. Gaps indicate missing or flagged daily observations. Exact values follow in the table.048May 1993: precipitation 1.50 inMay 2006: precipitation 6.72 inMay 2007: precipitation 4.04 inMay 2008: precipitation 1.44 inMay 2009: precipitation 5.48 inMay 2010: precipitation 2.91 inMay 2011: precipitation 4.69 inMay 2012: precipitation 7.53 inMay 2013: precipitation 6.46 inMay 2014: precipitation 2.57 in198220042025

Scroll the chart to see all years →

Hover, focus or tap a bar to see its year and value.

Acadia NP, ME station observations, not a park-wide average or forecast. Complete quality-screened calendar months only, separately by metric. Daily high/low means and total precipitation; incomplete months stay null. No interpolation or substitution. Completed years only; separate from 1991-2020 normals.

May in-park stays

the three road-access campgrounds, Duck Harbor lean-tos and the stock-only Wildwood Stables campground; there is no park lodge. Normal seasons are planning guidance, not vacancies. Opening/closing months are partial. Unverified means confirm directly. These are normal seasonal schedules, not room or campsite availability.

Frontcountry campground

  • 1Blackwoods
    Open

    Within the normal operating season. This is not room or campsite availability.

  • 2Seawall
    Part month

    The season normally begins or ends during this month. Confirm the dated operating calendar.

  • 3Schoodic Woods
    Part month

    The season normally begins or ends during this month. Confirm the dated operating calendar.

Walk-in island shelters

  • 4Duck Harbor
    Closed

    Outside the normal operating season. Check the published calendar for your dates.

Stock-only campground

  • Wildwood Stables
    Part month

    The season normally begins or ends during this month. Confirm the dated operating calendar.

NPS does not allow backcountry or winter camping. Duck Harbor shelters and stock-only Wildwood camping are identified separately.

June Busy 77% of August · 612K avg Good 74°F / 54°F (23°C / 12°C)
Full
access
Limitedlodging Warm walking weather. Duck Harbor normally begins during June.Read the June guide

June crowds

612,365 average June visits in 2021–2025.

Monthly recreation visits

47 annual records · 1979–2025

June recreation visits, 1979 to 2025NPS park-wide recreation visits for June in each year. The vertical scale starts at zero. Exact counts follow in the data table. Missing counts are gaps.0375k750k1979: 543,205 visits1980: 359,552 visits1981: 366,518 visits1982: 404,915 visits1983: 435,142 visits1984: 458,908 visits1985: 432,926 visits1986: 486,835 visits1987: 523,486 visits1988: 582,015 visits1989: 704,488 visits1990: 290,533 visits1991: 295,348 visits1992: 262,173 visits1993: 300,647 visits1994: 311,803 visits1995: 355,270 visits1996: 327,723 visits1997: 340,064 visits1998: 307,208 visits1999: 315,980 visits2000: 319,208 visits2001: 325,242 visits2002: 325,441 visits2003: 309,230 visits2004: 305,134 visits2005: 275,175 visits2006: 244,333 visits2007: 273,765 visits2008: 263,542 visits2009: 244,780 visits2010: 286,635 visits2011: 297,222 visits2012: 309,198 visits2013: 315,791 visits2014: 338,845 visits2015: 359,661 visits2016: 445,410 visits2017: 476,191 visits2018: 499,163 visits2019: 490,720 visits2020: 201,156 visits2021: 661,919 visits2022: 603,023 visits2023: 566,535 visits2024: 599,015 visits2025: 631,333 visits197919891999200920192025

Scroll the chart to see all years →

Hover, focus or tap a bar to see its year and value.

NPS recreation visits are visits, not unique visitors or a measure of how busy an individual trail feels. Counts can reflect closures, disruptions and changes in counting methods.

June weather

1991 through 2020 averages

Average high
74°F / 23°C
Average low
54°F / 12°C
Monthly precipitation
4.28 in / 109 mm

The Acadia NP NOAA station sits at ~470 ft near park headquarters, about 2.5 miles from the NPS API coordinate, so these numbers describe inland Mount Desert Island, not the summits or the open coast. NPS says weather on Cadillac Mountain (1,530 ft) and the other peaks can be very different from Bar Harbor.

June weather through the years at Acadia NP, ME.

Average daily high and low (°F)

16 complete high-temperature records · 25 complete low-temperature records

■ High■ Low

June: Average daily high and low (°F), 1982–2025Only complete calendar months are plotted. Gaps indicate missing or flagged daily observations. Exact values follow in the table.04080June 1983: average high 76.24 °FJune 1987: average high 72.67 °FJune 1988: average high 75.53 °FJune 1991: average high 77.57 °FJune 1992: average high 74.53 °FJune 1994: average high 75.24 °FJune 1997: average high 77.27 °FJune 1998: average high 70.17 °FJune 2003: average high 72.91 °FJune 2006: average high 72.07 °FJune 2007: average high 73.63 °FJune 2009: average high 69.50 °FJune 2010: average high 74.13 °FJune 2011: average high 70.80 °FJune 2012: average high 71.77 °FJune 2013: average high 73.57 °FJune 1983: average low 52.29 °FJune 1984: average low 51.35 °FJune 1986: average low 47.92 °FJune 1987: average low 49.70 °FJune 1988: average low 49.90 °FJune 1990: average low 49.96 °FJune 1991: average low 51.93 °FJune 1992: average low 51.54 °FJune 1993: average low 50.40 °FJune 1994: average low 53.49 °FJune 1995: average low 52.47 °FJune 1996: average low 51.90 °FJune 1997: average low 51.71 °FJune 1998: average low 49.90 °FJune 1999: average low 54.98 °FJune 2001: average low 55.00 °FJune 2002: average low 50.27 °FJune 2003: average low 54.33 °FJune 2007: average low 53.91 °FJune 2008: average low 54.84 °FJune 2009: average low 52.53 °FJune 2010: average low 54.93 °FJune 2011: average low 52.23 °FJune 2012: average low 52.41 °FJune 2013: average low 55.32 °F198220042025

Scroll the chart to see all years →

Hover, focus or tap a bar to see its year and value.

Monthly precipitation (inches)

12 complete rain records

June: Monthly precipitation (inches), 1982–2025Only complete calendar months are plotted. Gaps indicate missing or flagged daily observations. Exact values follow in the table.0612June 1989: precipitation 5.12 inJune 1991: precipitation 1.50 inJune 1993: precipitation 4.58 inJune 2001: precipitation 2.41 inJune 2006: precipitation 11.80 inJune 2007: precipitation 2.80 inJune 2008: precipitation 2.80 inJune 2009: precipitation 10.19 inJune 2010: precipitation 5.19 inJune 2011: precipitation 2.47 inJune 2012: precipitation 7.76 inJune 2013: precipitation 6.45 in198220042025

Scroll the chart to see all years →

Hover, focus or tap a bar to see its year and value.

Acadia NP, ME station observations, not a park-wide average or forecast. Complete quality-screened calendar months only, separately by metric. Daily high/low means and total precipitation; incomplete months stay null. No interpolation or substitution. Completed years only; separate from 1991-2020 normals.

June in-park stays

the three road-access campgrounds, Duck Harbor lean-tos and the stock-only Wildwood Stables campground; there is no park lodge. Normal seasons are planning guidance, not vacancies. Opening/closing months are partial. Unverified means confirm directly. These are normal seasonal schedules, not room or campsite availability.

Frontcountry campground

  • 1Blackwoods
    Open

    Within the normal operating season. This is not room or campsite availability.

  • 2Seawall
    Open

    Within the normal operating season. This is not room or campsite availability.

  • 3Schoodic Woods
    Open

    Within the normal operating season. This is not room or campsite availability.

Walk-in island shelters

  • 4Duck Harbor
    Part month

    The season normally begins or ends during this month. Confirm the dated operating calendar.

Stock-only campground

  • Wildwood Stables
    Open

    Within the normal operating season. This is not room or campsite availability.

NPS does not allow backcountry or winter camping. Duck Harbor shelters and stock-only Wildwood camping are identified separately.

July Peak 98% of August · 786K avg Good 79°F / 60°F (26°C / 16°C)
Full
access
Full
lodging
Warm summer conditions and heavy visitation. Prepare for quick weather changes.Read the July guide

July crowds

785,904 average July visits in 2021–2025.

Monthly recreation visits

47 annual records · 1979–2025

July recreation visits, 1979 to 2025NPS park-wide recreation visits for July in each year. The vertical scale starts at zero. Exact counts follow in the data table. Missing counts are gaps.0500k1000k1979: 383,341 visits1980: 533,885 visits1981: 545,981 visits1982: 737,860 visits1983: 916,474 visits1984: 790,392 visits1985: 725,951 visits1986: 717,864 visits1987: 751,309 visits1988: 799,802 visits1989: 999,535 visits1990: 554,953 visits1991: 574,529 visits1992: 539,109 visits1993: 586,449 visits1994: 617,622 visits1995: 626,947 visits1996: 571,017 visits1997: 622,847 visits1998: 565,477 visits1999: 562,996 visits2000: 547,929 visits2001: 558,641 visits2002: 571,119 visits2003: 547,836 visits2004: 471,406 visits2005: 468,512 visits2006: 476,631 visits2007: 461,894 visits2008: 470,295 visits2009: 457,622 visits2010: 545,382 visits2011: 559,892 visits2012: 539,234 visits2013: 555,308 visits2014: 561,073 visits2015: 606,597 visits2016: 696,854 visits2017: 743,529 visits2018: 759,165 visits2019: 756,439 visits2020: 493,971 visits2021: 782,146 visits2022: 791,358 visits2023: 767,956 visits2024: 791,029 visits2025: 797,030 visits197919891999200920192025

Scroll the chart to see all years →

Hover, focus or tap a bar to see its year and value.

NPS recreation visits are visits, not unique visitors or a measure of how busy an individual trail feels. Counts can reflect closures, disruptions and changes in counting methods.

July weather

1991 through 2020 averages

Average high
79°F / 26°C
Average low
60°F / 16°C
Monthly precipitation
3.27 in / 83 mm

The Acadia NP NOAA station sits at ~470 ft near park headquarters, about 2.5 miles from the NPS API coordinate, so these numbers describe inland Mount Desert Island, not the summits or the open coast. NPS says weather on Cadillac Mountain (1,530 ft) and the other peaks can be very different from Bar Harbor.

July weather through the years at Acadia NP, ME.

Average daily high and low (°F)

20 complete high-temperature records · 23 complete low-temperature records

■ High■ Low

July: Average daily high and low (°F), 1982–2025Only complete calendar months are plotted. Gaps indicate missing or flagged daily observations. Exact values follow in the table.04590July 1985: average high 79.07 °FJuly 1986: average high 74.47 °FJuly 1987: average high 76.41 °FJuly 1988: average high 80.16 °FJuly 1989: average high 80.30 °FJuly 1991: average high 81.98 °FJuly 1992: average high 75.50 °FJuly 1994: average high 82.50 °FJuly 1995: average high 81.29 °FJuly 1996: average high 74.86 °FJuly 1997: average high 81.67 °FJuly 2001: average high 78.06 °FJuly 2005: average high 78.00 °FJuly 2007: average high 77.11 °FJuly 2008: average high 80.09 °FJuly 2009: average high 72.23 °FJuly 2010: average high 80.58 °FJuly 2011: average high 81.44 °FJuly 2012: average high 81.62 °FJuly 2013: average high 81.77 °FJuly 1983: average low 56.24 °FJuly 1985: average low 57.19 °FJuly 1987: average low 54.89 °FJuly 1988: average low 57.63 °FJuly 1990: average low 57.82 °FJuly 1991: average low 56.46 °FJuly 1992: average low 53.32 °FJuly 1993: average low 56.64 °FJuly 1994: average low 61.21 °FJuly 1995: average low 59.16 °FJuly 1996: average low 55.30 °FJuly 1997: average low 57.07 °FJuly 1998: average low 57.91 °FJuly 2001: average low 55.62 °FJuly 2002: average low 57.91 °FJuly 2005: average low 59.18 °FJuly 2007: average low 58.89 °FJuly 2008: average low 62.21 °FJuly 2009: average low 57.70 °FJuly 2010: average low 62.47 °FJuly 2011: average low 61.69 °FJuly 2012: average low 61.80 °FJuly 2013: average low 62.65 °F198220042025

Scroll the chart to see all years →

Hover, focus or tap a bar to see its year and value.

Monthly precipitation (inches)

10 complete rain records

July: Monthly precipitation (inches), 1982–2025Only complete calendar months are plotted. Gaps indicate missing or flagged daily observations. Exact values follow in the table.048July 1991: precipitation 3.16 inJuly 1993: precipitation 2.13 inJuly 1996: precipitation 7.48 inJuly 2007: precipitation 3.33 inJuly 2008: precipitation 4.50 inJuly 2009: precipitation 6.69 inJuly 2010: precipitation 3.59 inJuly 2011: precipitation 1.83 inJuly 2012: precipitation 1.41 inJuly 2013: precipitation 4.49 in198220042025

Scroll the chart to see all years →

Hover, focus or tap a bar to see its year and value.

Acadia NP, ME station observations, not a park-wide average or forecast. Complete quality-screened calendar months only, separately by metric. Daily high/low means and total precipitation; incomplete months stay null. No interpolation or substitution. Completed years only; separate from 1991-2020 normals.

August Peak 100% of August · 799K avg Ideal 78°F / 60°F (26°C / 15°C)
Full
access
Full
lodging
The peak average month. Coastal weather can differ from inland station averages.Read the August guide

August crowds

798,914 average August visits in 2021–2025.

Monthly recreation visits

47 annual records · 1979–2025

August recreation visits, 1979 to 2025NPS park-wide recreation visits for August in each year. The vertical scale starts at zero. Exact counts follow in the data table. Missing counts are gaps.0525k1050k1979: 466,928 visits1980: 633,067 visits1981: 616,233 visits1982: 574,164 visits1983: 715,624 visits1984: 865,843 visits1985: 816,294 visits1986: 809,273 visits1987: 786,970 visits1988: 909,762 visits1989: 1,045,060 visits1990: 645,522 visits1991: 640,990 visits1992: 615,843 visits1993: 719,671 visits1994: 720,079 visits1995: 753,799 visits1996: 714,090 visits1997: 758,140 visits1998: 701,097 visits1999: 639,073 visits2000: 594,904 visits2001: 630,240 visits2002: 636,824 visits2003: 595,191 visits2004: 524,675 visits2005: 519,350 visits2006: 506,833 visits2007: 544,892 visits2008: 514,443 visits2009: 586,446 visits2010: 627,918 visits2011: 583,153 visits2012: 574,307 visits2013: 617,306 visits2014: 638,152 visits2015: 666,767 visits2016: 735,945 visits2017: 762,436 visits2018: 767,219 visits2019: 759,735 visits2020: 681,746 visits2021: 795,437 visits2022: 785,236 visits2023: 774,296 visits2024: 795,332 visits2025: 844,268 visits197919891999200920192025

Scroll the chart to see all years →

Hover, focus or tap a bar to see its year and value.

NPS recreation visits are visits, not unique visitors or a measure of how busy an individual trail feels. Counts can reflect closures, disruptions and changes in counting methods.

August weather

1991 through 2020 averages

Average high
78°F / 26°C
Average low
60°F / 15°C
Monthly precipitation
3.45 in / 88 mm

The Acadia NP NOAA station sits at ~470 ft near park headquarters, about 2.5 miles from the NPS API coordinate, so these numbers describe inland Mount Desert Island, not the summits or the open coast. NPS says weather on Cadillac Mountain (1,530 ft) and the other peaks can be very different from Bar Harbor.

August weather through the years at Acadia NP, ME.

Average daily high and low (°F)

21 complete high-temperature records · 24 complete low-temperature records

■ High■ Low

August: Average daily high and low (°F), 1982–2025Only complete calendar months are plotted. Gaps indicate missing or flagged daily observations. Exact values follow in the table.04590August 1985: average high 75.69 °FAugust 1986: average high 73.45 °FAugust 1987: average high 77.06 °FAugust 1988: average high 78.85 °FAugust 1989: average high 76.42 °FAugust 1990: average high 81.05 °FAugust 1991: average high 80.05 °FAugust 1992: average high 76.26 °FAugust 1993: average high 81.10 °FAugust 1994: average high 78.36 °FAugust 1995: average high 81.24 °FAugust 1996: average high 78.50 °FAugust 1997: average high 77.69 °FAugust 1998: average high 80.45 °FAugust 2003: average high 78.51 °FAugust 2007: average high 77.01 °FAugust 2008: average high 74.10 °FAugust 2009: average high 79.01 °FAugust 2010: average high 79.24 °FAugust 2012: average high 80.04 °FAugust 2013: average high 77.39 °FAugust 1984: average low 58.81 °FAugust 1985: average low 53.65 °FAugust 1986: average low 54.06 °FAugust 1987: average low 53.65 °FAugust 1988: average low 57.95 °FAugust 1989: average low 53.71 °FAugust 1990: average low 58.31 °FAugust 1991: average low 57.22 °FAugust 1992: average low 55.12 °FAugust 1993: average low 55.80 °FAugust 1994: average low 56.18 °FAugust 1996: average low 56.55 °FAugust 1997: average low 56.79 °FAugust 1998: average low 57.62 °FAugust 1999: average low 56.73 °FAugust 2001: average low 57.83 °FAugust 2003: average low 61.54 °FAugust 2005: average low 61.47 °FAugust 2007: average low 58.76 °FAugust 2008: average low 57.62 °FAugust 2009: average low 60.65 °FAugust 2010: average low 60.74 °FAugust 2012: average low 62.66 °FAugust 2013: average low 58.73 °F198220042025

Scroll the chart to see all years →

Hover, focus or tap a bar to see its year and value.

Monthly precipitation (inches)

9 complete rain records

August: Monthly precipitation (inches), 1982–2025Only complete calendar months are plotted. Gaps indicate missing or flagged daily observations. Exact values follow in the table.04.59August 1991: precipitation 8.69 inAugust 1993: precipitation 0.69 inAugust 2001: precipitation 1.07 inAugust 2007: precipitation 2.56 inAugust 2008: precipitation 5.68 inAugust 2009: precipitation 5.70 inAugust 2010: precipitation 2.28 inAugust 2012: precipitation 5.74 inAugust 2013: precipitation 3.71 in198220042025

Scroll the chart to see all years →

Hover, focus or tap a bar to see its year and value.

Acadia NP, ME station observations, not a park-wide average or forecast. Complete quality-screened calendar months only, separately by metric. Daily high/low means and total precipitation; incomplete months stay null. No interpolation or substitution. Completed years only; separate from 1991-2020 normals.

September Peak 83% of August · 663K avg Good 71°F / 53°F (22°C / 12°C)
Full
access
Full
lodging
Our pick for mild walks and fewer average visits than August. It is still busy.Read the September guide

September crowds

662,737 average September visits in 2021–2025.

Monthly recreation visits

47 annual records · 1979–2025

September recreation visits, 1979 to 2025NPS park-wide recreation visits for September in each year. The vertical scale starts at zero. Exact counts follow in the data table. Missing counts are gaps.0350k700k1979: 320,138 visits1980: 282,636 visits1981: 463,823 visits1982: 541,721 visits1983: 668,981 visits1984: 443,622 visits1985: 451,026 visits1986: 488,247 visits1987: 562,309 visits1988: 601,530 visits1989: 666,669 visits1990: 355,864 visits1991: 377,904 visits1992: 391,798 visits1993: 417,317 visits1994: 421,106 visits1995: 439,553 visits1996: 426,562 visits1997: 404,808 visits1998: 391,378 visits1999: 426,024 visits2000: 378,135 visits2001: 377,456 visits2002: 392,531 visits2003: 376,060 visits2004: 357,146 visits2005: 321,070 visits2006: 330,649 visits2007: 371,217 visits2008: 319,582 visits2009: 399,789 visits2010: 431,001 visits2011: 387,868 visits2012: 391,810 visits2013: 400,400 visits2014: 418,173 visits2015: 479,320 visits2016: 570,434 visits2017: 595,388 visits2018: 600,397 visits2019: 603,273 visits2020: 500,320 visits2021: 667,301 visits2022: 697,292 visits2023: 643,506 visits2024: 646,116 visits2025: 659,471 visits197919891999200920192025

Scroll the chart to see all years →

Hover, focus or tap a bar to see its year and value.

NPS recreation visits are visits, not unique visitors or a measure of how busy an individual trail feels. Counts can reflect closures, disruptions and changes in counting methods.

September weather

1991 through 2020 averages

Average high
71°F / 22°C
Average low
53°F / 12°C
Monthly precipitation
4.22 in / 107 mm

The Acadia NP NOAA station sits at ~470 ft near park headquarters, about 2.5 miles from the NPS API coordinate, so these numbers describe inland Mount Desert Island, not the summits or the open coast. NPS says weather on Cadillac Mountain (1,530 ft) and the other peaks can be very different from Bar Harbor.

September weather through the years at Acadia NP, ME.

Average daily high and low (°F)

20 complete high-temperature records · 23 complete low-temperature records

■ High■ Low

September: Average daily high and low (°F), 1982–2025Only complete calendar months are plotted. Gaps indicate missing or flagged daily observations. Exact values follow in the table.04080September 1982: average high 68.61 °FSeptember 1983: average high 74.23 °FSeptember 1984: average high 69.63 °FSeptember 1985: average high 70.53 °FSeptember 1986: average high 66.21 °FSeptember 1988: average high 68.50 °FSeptember 1989: average high 71.19 °FSeptember 1992: average high 69.33 °FSeptember 1993: average high 69.00 °FSeptember 1994: average high 67.69 °FSeptember 1995: average high 68.62 °FSeptember 1996: average high 67.28 °FSeptember 1997: average high 67.81 °FSeptember 2005: average high 72.30 °FSeptember 2006: average high 69.67 °FSeptember 2008: average high 69.25 °FSeptember 2009: average high 69.14 °FSeptember 2010: average high 71.45 °FSeptember 2011: average high 71.89 °FSeptember 2012: average high 69.33 °FSeptember 1982: average low 49.78 °FSeptember 1983: average low 52.89 °FSeptember 1984: average low 46.37 °FSeptember 1985: average low 48.69 °FSeptember 1986: average low 46.16 °FSeptember 1987: average low 48.91 °FSeptember 1988: average low 47.06 °FSeptember 1989: average low 49.13 °FSeptember 1990: average low 48.04 °FSeptember 1991: average low 46.87 °FSeptember 1992: average low 49.00 °FSeptember 1996: average low 49.13 °FSeptember 1997: average low 49.09 °FSeptember 1998: average low 50.54 °FSeptember 1999: average low 55.77 °FSeptember 2002: average low 52.85 °FSeptember 2005: average low 56.04 °FSeptember 2006: average low 52.75 °FSeptember 2007: average low 54.07 °FSeptember 2008: average low 50.91 °FSeptember 2010: average low 54.43 °FSeptember 2011: average low 55.11 °FSeptember 2012: average low 53.53 °F198220042025

Scroll the chart to see all years →

Hover, focus or tap a bar to see its year and value.

Monthly precipitation (inches)

10 complete rain records

September: Monthly precipitation (inches), 1982–2025Only complete calendar months are plotted. Gaps indicate missing or flagged daily observations. Exact values follow in the table.0612September 1991: precipitation 6.72 inSeptember 1992: precipitation 2.70 inSeptember 1993: precipitation 5.63 inSeptember 2006: precipitation 3.31 inSeptember 2007: precipitation 3.81 inSeptember 2008: precipitation 11.07 inSeptember 2009: precipitation 2.66 inSeptember 2010: precipitation 5.33 inSeptember 2011: precipitation 2.11 inSeptember 2012: precipitation 7.00 in198220042025

Scroll the chart to see all years →

Hover, focus or tap a bar to see its year and value.

Acadia NP, ME station observations, not a park-wide average or forecast. Complete quality-screened calendar months only, separately by metric. Daily high/low means and total precipitation; incomplete months stay null. No interpolation or substitution. Completed years only; separate from 1991-2020 normals.

October Busy 70% of August · 557K avg Mixed 59°F / 43°F (15°C / 6°C)
Full
access
Limitedlodging Cooler and wetter than September. Campgrounds close during the month.Read the October guide

October crowds

557,411 average October visits in 2021–2025.

Monthly recreation visits

47 annual records · 1979–2025

October recreation visits, 1979 to 2025NPS park-wide recreation visits for October in each year. The vertical scale starts at zero. Exact counts follow in the data table. Missing counts are gaps.0325k650k1979: 300,976 visits1980: 332,937 visits1981: 313,788 visits1982: 446,170 visits1983: 529,524 visits1984: 361,873 visits1985: 373,037 visits1986: 407,396 visits1987: 444,810 visits1988: 455,637 visits1989: 610,334 visits1990: 207,770 visits1991: 224,497 visits1992: 211,573 visits1993: 254,615 visits1994: 268,779 visits1995: 271,606 visits1996: 280,577 visits1997: 287,171 visits1998: 266,138 visits1999: 277,644 visits2000: 253,626 visits2001: 257,280 visits2002: 271,312 visits2003: 262,412 visits2004: 261,284 visits2005: 207,599 visits2006: 249,850 visits2007: 263,311 visits2008: 246,533 visits2009: 258,007 visits2010: 289,114 visits2011: 270,477 visits2012: 302,932 visits2013: 94,904 visits2014: 313,920 visits2015: 344,362 visits2016: 412,416 visits2017: 507,594 visits2018: 488,204 visits2019: 436,194 visits2020: 480,859 visits2021: 557,624 visits2022: 521,646 visits2023: 541,067 visits2024: 567,466 visits2025: 599,253 visits197919891999200920192025

Scroll the chart to see all years →

Hover, focus or tap a bar to see its year and value.

NPS recreation visits are visits, not unique visitors or a measure of how busy an individual trail feels. Counts can reflect closures, disruptions and changes in counting methods.

October weather

1991 through 2020 averages

Average high
59°F / 15°C
Average low
43°F / 6°C
Monthly precipitation
5.86 in / 149 mm

The Acadia NP NOAA station sits at ~470 ft near park headquarters, about 2.5 miles from the NPS API coordinate, so these numbers describe inland Mount Desert Island, not the summits or the open coast. NPS says weather on Cadillac Mountain (1,530 ft) and the other peaks can be very different from Bar Harbor.

October weather through the years at Acadia NP, ME.

Average daily high and low (°F)

17 complete high-temperature records · 23 complete low-temperature records

■ High■ Low

October: Average daily high and low (°F), 1982–2025Only complete calendar months are plotted. Gaps indicate missing or flagged daily observations. Exact values follow in the table.03570October 1982: average high 59.45 °FOctober 1984: average high 61.25 °FOctober 1985: average high 58.97 °FOctober 1987: average high 57.41 °FOctober 1988: average high 53.42 °FOctober 1991: average high 58.62 °FOctober 1992: average high 55.92 °FOctober 1996: average high 55.92 °FOctober 2005: average high 57.18 °FOctober 2006: average high 57.08 °FOctober 2007: average high 62.25 °FOctober 2008: average high 57.64 °FOctober 2009: average high 54.14 °FOctober 2010: average high 58.12 °FOctober 2011: average high 59.51 °FOctober 2012: average high 60.60 °FOctober 2013: average high 61.53 °FOctober 1982: average low 39.81 °FOctober 1983: average low 40.43 °FOctober 1984: average low 40.16 °FOctober 1985: average low 39.38 °FOctober 1986: average low 38.45 °FOctober 1987: average low 40.07 °FOctober 1988: average low 37.19 °FOctober 1991: average low 41.36 °FOctober 1992: average low 37.38 °FOctober 1993: average low 35.23 °FOctober 1994: average low 39.48 °FOctober 1995: average low 44.41 °FOctober 1996: average low 38.01 °FOctober 2002: average low 38.10 °FOctober 2005: average low 44.43 °FOctober 2006: average low 42.35 °FOctober 2007: average low 46.10 °FOctober 2008: average low 40.88 °FOctober 2009: average low 39.87 °FOctober 2010: average low 44.29 °FOctober 2011: average low 44.90 °FOctober 2012: average low 45.76 °FOctober 2013: average low 43.65 °F198220042025

Scroll the chart to see all years →

Hover, focus or tap a bar to see its year and value.

Monthly precipitation (inches)

13 complete rain records

October: Monthly precipitation (inches), 1982–2025Only complete calendar months are plotted. Gaps indicate missing or flagged daily observations. Exact values follow in the table.0816October 1984: precipitation 2.20 inOctober 1991: precipitation 5.89 inOctober 1993: precipitation 6.31 inOctober 2004: precipitation 2.95 inOctober 2005: precipitation 15.61 inOctober 2006: precipitation 9.21 inOctober 2007: precipitation 5.52 inOctober 2008: precipitation 3.64 inOctober 2009: precipitation 7.32 inOctober 2010: precipitation 8.87 inOctober 2011: precipitation 8.47 inOctober 2012: precipitation 6.26 inOctober 2013: precipitation 1.10 in198220042025

Scroll the chart to see all years →

Hover, focus or tap a bar to see its year and value.

Acadia NP, ME station observations, not a park-wide average or forecast. Complete quality-screened calendar months only, separately by metric. Daily high/low means and total precipitation; incomplete months stay null. No interpolation or substitution. Completed years only; separate from 1991-2020 normals.

October in-park stays

the three road-access campgrounds, Duck Harbor lean-tos and the stock-only Wildwood Stables campground; there is no park lodge. Normal seasons are planning guidance, not vacancies. Opening/closing months are partial. Unverified means confirm directly. These are normal seasonal schedules, not room or campsite availability.

Frontcountry campground

  • 1Blackwoods
    Part month

    The season normally begins or ends during this month. Confirm the dated operating calendar.

  • 2Seawall
    Part month

    The season normally begins or ends during this month. Confirm the dated operating calendar.

  • 3Schoodic Woods
    Part month

    The season normally begins or ends during this month. Confirm the dated operating calendar.

Walk-in island shelters

  • 4Duck Harbor
    Part month

    The season normally begins or ends during this month. Confirm the dated operating calendar.

Stock-only campground

  • Wildwood Stables
    Part month

    The season normally begins or ends during this month. Confirm the dated operating calendar.

NPS does not allow backcountry or winter camping. Duck Harbor shelters and stock-only Wildwood camping are identified separately.

November Lowest 9% of August · 73K avg Rough 48°F / 33°F (9°C / 0°C)
Full
access
Closedlodging A colder alternative with no standard park camping season. Check weather before a scenic drive.Read the November guide

November crowds

72,629 average November visits in 2021–2025.

Monthly recreation visits

47 annual records · 1979–2025

November recreation visits, 1979 to 2025NPS park-wide recreation visits for November in each year. The vertical scale starts at zero. Exact counts follow in the data table. Missing counts are gaps.0175k350k1979: 183,750 visits1980: 200,461 visits1981: 203,741 visits1982: 303,753 visits1983: 262,444 visits1984: 194,735 visits1985: 206,970 visits1986: 204,770 visits1987: 299,699 visits1988: 303,503 visits1989: 302,857 visits1990: 47,633 visits1991: 45,518 visits1992: 46,316 visits1993: 43,755 visits1994: 48,907 visits1995: 54,121 visits1996: 56,828 visits1997: 57,810 visits1998: 55,225 visits1999: 39,416 visits2000: 33,693 visits2001: 41,353 visits2002: 36,589 visits2003: 44,294 visits2004: 34,125 visits2005: 37,101 visits2006: 33,903 visits2007: 41,449 visits2008: 32,759 visits2009: 44,042 visits2010: 36,736 visits2011: 34,192 visits2012: 38,385 visits2013: 41,181 visits2014: 31,013 visits2015: 48,912 visits2016: 55,022 visits2017: 53,006 visits2018: 40,930 visits2019: 46,011 visits2020: 76,251 visits2021: 81,089 visits2022: 70,675 visits2023: 66,987 visits2024: 76,388 visits2025: 68,005 visits197919891999200920192025

Scroll the chart to see all years →

Hover, focus or tap a bar to see its year and value.

NPS recreation visits are visits, not unique visitors or a measure of how busy an individual trail feels. Counts can reflect closures, disruptions and changes in counting methods.

November weather

1991 through 2020 averages

Average high
48°F / 9°C
Average low
33°F / 0°C
Monthly precipitation
5.89 in / 150 mm

The Acadia NP NOAA station sits at ~470 ft near park headquarters, about 2.5 miles from the NPS API coordinate, so these numbers describe inland Mount Desert Island, not the summits or the open coast. NPS says weather on Cadillac Mountain (1,530 ft) and the other peaks can be very different from Bar Harbor.

November weather through the years at Acadia NP, ME.

Average daily high and low (°F)

13 complete high-temperature records · 17 complete low-temperature records

■ High■ Low

November: Average daily high and low (°F), 1982–2025Only complete calendar months are plotted. Gaps indicate missing or flagged daily observations. Exact values follow in the table.03060November 1985: average high 44.77 °FNovember 1986: average high 44.04 °FNovember 1988: average high 48.51 °FNovember 1993: average high 49.06 °FNovember 2002: average high 44.91 °FNovember 2005: average high 51.03 °FNovember 2007: average high 45.87 °FNovember 2008: average high 46.96 °FNovember 2009: average high 53.30 °FNovember 2010: average high 48.06 °FNovember 2011: average high 51.92 °FNovember 2012: average high 46.59 °FNovember 2013: average high 48.13 °FNovember 1985: average low 29.03 °FNovember 1987: average low 27.42 °FNovember 1990: average low 31.57 °FNovember 1993: average low 29.04 °FNovember 1994: average low 32.07 °FNovember 1995: average low 27.10 °FNovember 1996: average low 26.80 °FNovember 1997: average low 28.42 °FNovember 2002: average low 30.97 °FNovember 2005: average low 33.71 °FNovember 2007: average low 30.36 °FNovember 2008: average low 33.89 °FNovember 2009: average low 37.89 °FNovember 2010: average low 33.66 °FNovember 2011: average low 37.80 °FNovember 2012: average low 33.01 °FNovember 2013: average low 31.20 °F198220042025

Scroll the chart to see all years →

Hover, focus or tap a bar to see its year and value.

Monthly precipitation (inches)

10 complete rain records

November: Monthly precipitation (inches), 1982–2025Only complete calendar months are plotted. Gaps indicate missing or flagged daily observations. Exact values follow in the table.04.59November 1986: precipitation 8.49 inNovember 1993: precipitation 6.56 inNovember 2006: precipitation 8.16 inNovember 2007: precipitation 7.51 inNovember 2008: precipitation 5.98 inNovember 2009: precipitation 4.68 inNovember 2010: precipitation 6.63 inNovember 2011: precipitation 3.64 inNovember 2012: precipitation 1.47 inNovember 2013: precipitation 5.57 in198220042025

Scroll the chart to see all years →

Hover, focus or tap a bar to see its year and value.

Acadia NP, ME station observations, not a park-wide average or forecast. Complete quality-screened calendar months only, separately by metric. Daily high/low means and total precipitation; incomplete months stay null. No interpolation or substitution. Completed years only; separate from 1991-2020 normals.

November in-park stays

the three road-access campgrounds, Duck Harbor lean-tos and the stock-only Wildwood Stables campground; there is no park lodge. Normal seasons are planning guidance, not vacancies. Opening/closing months are partial. Unverified means confirm directly. These are normal seasonal schedules, not room or campsite availability.

Frontcountry campground

  • 1Blackwoods
    Closed

    Outside the normal operating season. Check the published calendar for your dates.

  • 2Seawall
    Closed

    Outside the normal operating season. Check the published calendar for your dates.

  • 3Schoodic Woods
    Closed

    Outside the normal operating season. Check the published calendar for your dates.

Walk-in island shelters

  • 4Duck Harbor
    Closed

    Outside the normal operating season. Check the published calendar for your dates.

Stock-only campground

  • Wildwood Stables
    Closed

    Outside the normal operating season. Check the published calendar for your dates.

NPS does not allow backcountry or winter camping. Duck Harbor shelters and stock-only Wildwood camping are identified separately.

December Lowest 2% of August · 16K avg Harsh 38°F / 22°F (3°C / -5°C) Limitedaccess Closedlodging Winter vehicle limits return to most of the Park Loop. No winter camping.Read the December guide

December crowds

15,739 average December visits in 2021–2025.

Monthly recreation visits

47 annual records · 1979–2025

December recreation visits, 1979 to 2025NPS park-wide recreation visits for December in each year. The vertical scale starts at zero. Exact counts follow in the data table. Missing counts are gaps.050k100k1979: 7,842 visits1980: 20,252 visits1981: 25,857 visits1982: 28,370 visits1983: 27,228 visits1984: 30,041 visits1985: 35,245 visits1986: 36,325 visits1987: 54,679 visits1988: 50,307 visits1989: 50,124 visits1990: 11,801 visits1991: 13,535 visits1992: 18,693 visits1993: 19,052 visits1994: 20,322 visits1995: 14,810 visits1996: 19,464 visits1997: 19,710 visits1998: 16,772 visits1999: 16,211 visits2000: 14,961 visits2001: 15,490 visits2002: 14,205 visits2003: 12,968 visits2004: 12,221 visits2005: 11,016 visits2006: 13,353 visits2007: 9,070 visits2008: 9,862 visits2009: 9,475 visits2010: 9,544 visits2011: 11,343 visits2012: 11,307 visits2013: 7,540 visits2014: 13,510 visits2015: 13,880 visits2016: 14,111 visits2017: 12,084 visits2018: 12,692 visits2019: 12,865 visits2020: 21,260 visits2021: 14,381 visits2022: 22,506 visits2023: 14,870 visits2024: 14,960 visits2025: 11,980 visits197919891999200920192025

Scroll the chart to see all years →

Hover, focus or tap a bar to see its year and value.

NPS recreation visits are visits, not unique visitors or a measure of how busy an individual trail feels. Counts can reflect closures, disruptions and changes in counting methods.

December weather

1991 through 2020 averages

Average high
38°F / 3°C
Average low
22°F / -5°C
Monthly precipitation
5.66 in / 144 mm

The Acadia NP NOAA station sits at ~470 ft near park headquarters, about 2.5 miles from the NPS API coordinate, so these numbers describe inland Mount Desert Island, not the summits or the open coast. NPS says weather on Cadillac Mountain (1,530 ft) and the other peaks can be very different from Bar Harbor.

December weather through the years at Acadia NP, ME.

Average daily high and low (°F)

11 complete high-temperature records · 10 complete low-temperature records

■ High■ Low

December: Average daily high and low (°F), 1982–2025Only complete calendar months are plotted. Gaps indicate missing or flagged daily observations. Exact values follow in the table.02550December 1985: average high 31.74 °FDecember 1986: average high 35.12 °FDecember 1987: average high 33.70 °FDecember 1993: average high 36.93 °FDecember 2006: average high 42.80 °FDecember 2007: average high 34.03 °FDecember 2008: average high 40.38 °FDecember 2010: average high 35.04 °FDecember 2011: average high 42.16 °FDecember 2012: average high 39.16 °FDecember 2013: average high 33.65 °FDecember 1982: average low 21.33 °FDecember 1985: average low 11.41 °FDecember 1986: average low 16.21 °FDecember 1987: average low 18.44 °FDecember 2006: average low 26.35 °FDecember 2007: average low 18.20 °FDecember 2008: average low 20.63 °FDecember 2010: average low 22.46 °FDecember 2012: average low 25.36 °FDecember 2013: average low 18.09 °F198220042025

Scroll the chart to see all years →

Hover, focus or tap a bar to see its year and value.

Monthly precipitation (inches)

7 complete rain records

December: Monthly precipitation (inches), 1982–2025Only complete calendar months are plotted. Gaps indicate missing or flagged daily observations. Exact values follow in the table.04.59December 2006: precipitation 5.78 inDecember 2007: precipitation 5.78 inDecember 2008: precipitation 5.47 inDecember 2010: precipitation 8.49 inDecember 2011: precipitation 5.48 inDecember 2012: precipitation 6.44 inDecember 2013: precipitation 3.49 in198220042025

Scroll the chart to see all years →

Hover, focus or tap a bar to see its year and value.

Acadia NP, ME station observations, not a park-wide average or forecast. Complete quality-screened calendar months only, separately by metric. Daily high/low means and total precipitation; incomplete months stay null. No interpolation or substitution. Completed years only; separate from 1991-2020 normals.

December access

Typical entrance access. Oversnow means winter snowcoach or snowmobile travel, not regular vehicles. Check each entrance’s travel restrictions.

Approaches and visitor areas Acadia has several access points. Mount Desert Island and Schoodic use separate road approaches. Winter vehicle access covers only parts of the Park Loop rather than the complete circuit. Lettered points are the reviewed entrance or access-area locations. They do not mark every road, trail or gate. Park Loop Road Entrance (Route 233)A Sand Beach Entrance StationB Schoodic Entrance (SERC)F year-round access at Schooner Head RoadC Blackwoods Campground Entrance StationD Seawall Campground Entrance StationEN
  • Park boundary
  • APark Loop Road Entrance (Route 233)
    Oversnow

    Most of the Park Loop has a winter vehicle closure. The limited winter sections are a different route.

  • BSand Beach Entrance Station
    Open

    Normal road approach, subject to weather and individual site restrictions. This marker is an access location, not a guarantee that every facility is operating.

  • Cyear-round access at Schooner Head Road
    Open

    Normal road approach, subject to weather and individual site restrictions. This marker is an access location, not a guarantee that every facility is operating.

  • DBlackwoods Campground Entrance Station
    Closed

    Campground approach follows the camping season. Outside the normal operating season. Check the published calendar for your dates.

  • ESeawall Campground Entrance Station
    Closed

    Campground approach follows the camping season. Outside the normal operating season. Check the published calendar for your dates.

  • FSchoodic Entrance (SERC)
    Open

    Normal road approach, subject to weather and individual site restrictions. This marker is an access location, not a guarantee that every facility is operating.

December in-park stays

the three road-access campgrounds, Duck Harbor lean-tos and the stock-only Wildwood Stables campground; there is no park lodge. Normal seasons are planning guidance, not vacancies. Opening/closing months are partial. Unverified means confirm directly. These are normal seasonal schedules, not room or campsite availability.

Frontcountry campground

  • 1Blackwoods
    Closed

    Outside the normal operating season. Check the published calendar for your dates.

  • 2Seawall
    Closed

    Outside the normal operating season. Check the published calendar for your dates.

  • 3Schoodic Woods
    Closed

    Outside the normal operating season. Check the published calendar for your dates.

Walk-in island shelters

  • 4Duck Harbor
    Closed

    Outside the normal operating season. Check the published calendar for your dates.

Stock-only campground

  • Wildwood Stables
    Closed

    Outside the normal operating season. Check the published calendar for your dates.

NPS does not allow backcountry or winter camping. Duck Harbor shelters and stock-only Wildwood camping are identified separately.

September caveat

September retains mild walking weather and lower monthly average visits than August. This is still a busy month. June is a warmer alternative with longer days; October suits people prepared for colder, wetter walks.

Roads and approaches

Acadia has several access points. Mount Desert Island and Schoodic use separate road approaches. Winter vehicle access covers only parts of the Park Loop rather than the complete circuit.

Acadia road approaches Acadia has several access points. Mount Desert Island and Schoodic use separate road approaches. Winter vehicle access covers only parts of the Park Loop rather than the complete circuit. Lettered points are the reviewed entrance or access-area locations. They do not mark every road, trail or gate. Park Loop Road Entrance (Route 233)A Sand Beach Entrance StationB Schoodic Entrance (SERC)F year-round access at Schooner Head RoadC Blackwoods Campground Entrance StationD Seawall Campground Entrance StationEN
  • Park boundary
  1. Park Loop Road Entrance (Route 233)

    Most of the Park Loop has a winter vehicle closure. The limited winter sections are a different route.

  2. Sand Beach Entrance Station

    Normal road approach, subject to weather and individual site restrictions. This marker is an access location, not a guarantee that every facility is operating.

  3. year-round access at Schooner Head Road

    Normal road approach, subject to weather and individual site restrictions. This marker is an access location, not a guarantee that every facility is operating.

  4. Blackwoods Campground Entrance Station

    Campground approach follows the camping season. Outside the normal operating season. Check the published calendar for your dates.

  5. Seawall Campground Entrance Station

    Campground approach follows the camping season. Outside the normal operating season. Check the published calendar for your dates.

  6. Schoodic Entrance (SERC)

    Normal road approach, subject to weather and individual site restrictions. This marker is an access location, not a guarantee that every facility is operating.

Lodging and camping

The road-access campgrounds run from spring into fall. Duck Harbor requires a separate island journey. Wildwood Stables serves visitors with stock animals. Outside towns supply hotel options.

Acadia campground locations Numbered NPS campground points locate the camping areas. Lodges without independently reviewed coordinates remain in the list rather than being placed at guessed locations. Schoodic Woods3 Blackwoods1 Seawall2 Duck Harbor4N
  • Park boundary
  1. Blackwoods

    Frontcountry campground. Normally May through October. Opening and closing months can be partial. Confirm the dated calendar and your reservation.

  2. Seawall

    Frontcountry campground. Normally May through October. Opening and closing months can be partial. Confirm the dated calendar and your reservation.

  3. Schoodic Woods

    Frontcountry campground. Normally May through October. Opening and closing months can be partial. Confirm the dated calendar and your reservation.

  4. Duck Harbor

    Walk-in island shelters. Normally June through October. Opening and closing months can be partial. Confirm the dated calendar and your reservation.

  5. Wildwood Stables

    Stock-only campground. Normally late May to mid-October, for visitors with stock animals. This is separate from general road-access camping.

Staying outside the park

Compare bases near Acadia by entrance and season.

Places to stay outside Acadia Census internal points locate gateway areas, not hotels or campground buildings. Match the base to the named approach. Winter Harbor area3 Bar Harbor area1 Southwest Harbor area2N
  • Park boundary
  1. Bar Harbor

    Use this Mount Desert Island base for Park Loop approaches. Confirm your property dates and the route to each stop.

  2. Southwest Harbor

    A base on western Mount Desert Island for the Seawall area. Reaching eastern Park Loop stops requires a separate drive.

  3. Winter Harbor

    Choose this mainland base for Schoodic. It uses a separate approach from Mount Desert Island.

Hotels or an Airbnb?

Search your dates, group size and entrance.

Hotel or motel
Check price, arrival hours, parking and breakfast.
Cabin or vacation rental
Check location, kitchen, minimum stay, fees and cancellation terms.

Confirm availability before booking.

Which month fits your trip?

Choose your Acadia dates around what you want to do. These guides cover the details.

Summer with kids

June before peak crowds, low-tide tidepool walks, and the tide and cold-water rules for kids.

Camping or an RV

Four campgrounds, all booked on Recreation.gov. Blackwoods stays open latest: its last 2026 night is October 18.

Wildlife and photography

Time Acadia around the Cadillac sunrise reservation, Thunder Hole's high tide, and October color.

Spring

Plan seasonal highlights, access, weather and crowds.

Summer

Plan seasonal highlights, access, weather and crowds.

Fall

Plan seasonal highlights, access, weather and crowds.

Winter

Drive the coast stretch past Sand Beach, ski the carriage roads, and sleep in town: no winter camping.

Questions about when to go.

What is the best month to visit Acadia?

September is our pick for this trip. September retains mild walking weather and lower monthly average visits than August. This is still a busy month. June is a warmer alternative with longer days; October suits people prepared for colder, wetter walks.

What months are best for Acadia?

May through October suit the core trip described here. May offers mild daytime normals and the complete road season, although some campgrounds start later. April has a partial road month and cold nights. October remains suitable for layered walks despite cooler weather and stay closures. November is colder, wetter and outside campground seasons.

When is Acadia least crowded?

February has the lowest average recreation visits in the 2021–2025 data. Low visits do not establish suitable weather, open roads or an empty trail.

Can you stay inside Acadia?

The road-access campgrounds run from spring into fall. Duck Harbor requires a separate island journey. Wildwood Stables serves visitors with stock animals. Outside towns supply hotel options. Confirm campground seasons and reservation links before booking.

How we built this page.

An independent guide using official data. Not affiliated with or endorsed by the National Park Service.

Crowds
2021–2025 monthly averages. NPS recreation visits, compared with the park’s own busiest month. Visits are not unique visitors or a count of people on a trail.
Weather
1991-2020 climate normals. NOAA’s Acadia NP, ME station. These describe typical weather at the station, not every part of the park or a forecast.
Roads & lodging
Normal seasonal schedules. NPS guidance and official operator information. Confirm access, hours and availability before you travel.

The Almanac Mailing

The next Acadia
window, in your inbox.

One email a month. The park to point at, the week to book, the trail that's about to fill up. Unsubscribe in a click.

One email per month. We file your address with care.