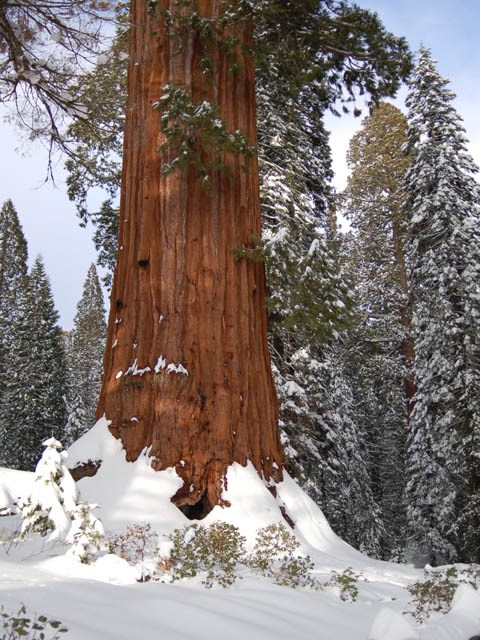
Sequoia for a giant-tree visit
Start with Giant Forest and General Sherman. Build in time to walk among the trees, then consider other Sequoia stops that fit your route.
Sequoia vs Yosemite: choose Sequoia for giant sequoia groves and the General Sherman Tree. Choose Yosemite for granite cliffs and waterfalls in Yosemite Valley. Yosemite also has giant sequoias, so the choice is what you want to build the visit around. Plan separate park days if visiting both.
Check official entry guidance, roads, trails and weather before setting your route.
Check official entry guidance, roads, trails and weather before setting your route.
Choose your entrances and actual stops before mapping transfers or booking a base.
Choose a giant-tree focus or a Yosemite Valley focus. Both parks offer more than one kind of scenery.
Start with Giant Forest and General Sherman. Build in time to walk among the trees, then consider other Sequoia stops that fit your route.
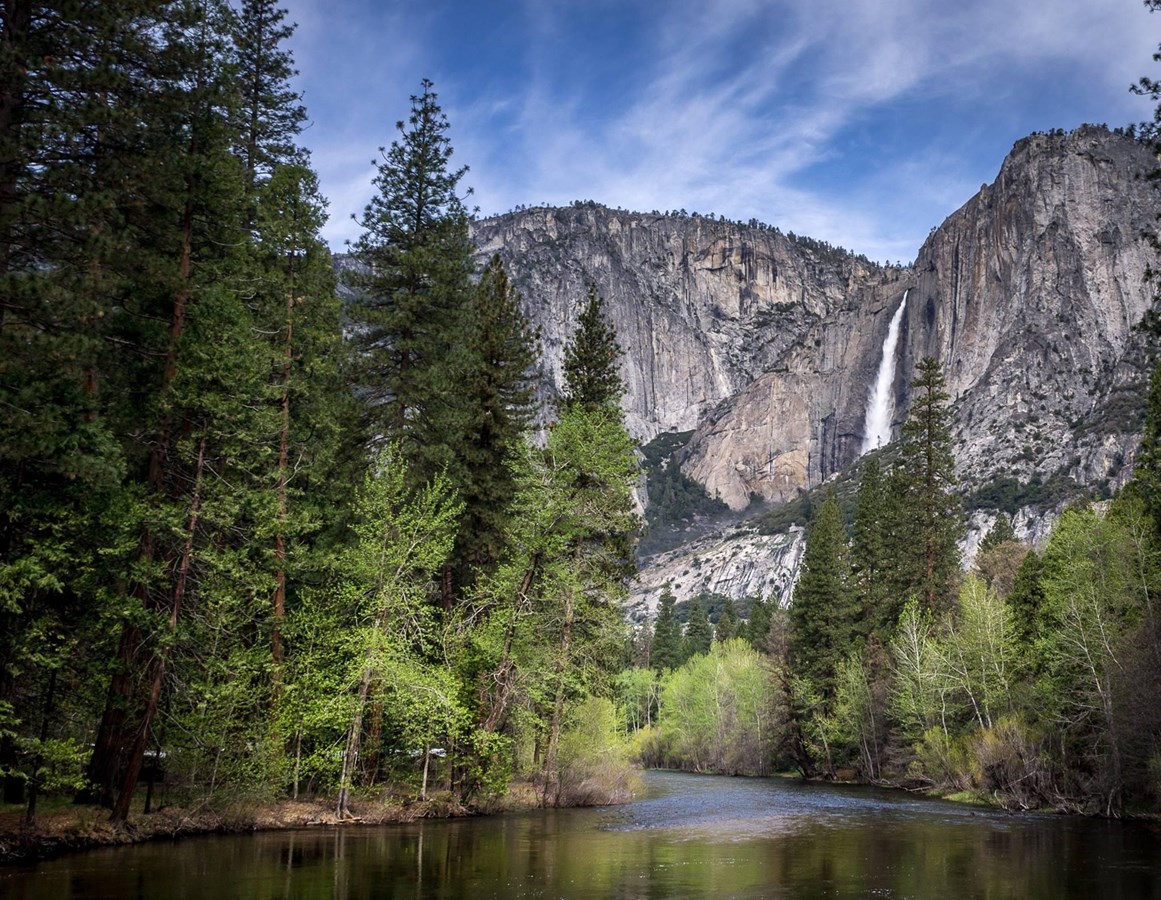
Make Yosemite Valley the focus if cliffs and waterfalls top your list. Yosemite’s sequoia groves are another option, rather than a reason to treat the parks as identical.
Sequoia peaks in July and Yosemite in August in the 2021–2025 averages. Each chart compares a park with its own busiest month. Sequoia’s totals exclude Kings Canyon; Yosemite’s cover the whole national park.
| Month | Sequoia | Yosemite |
|---|---|---|
| January | 44,73623% of peakLow | 115,01421% of peakLow |
| February | 40,61621% of peakLow | 129,41224% of peakLow |
| March | 57,03829% of peakLow | 136,08125% of peakLow |
| April | 82,30542% of peakModerate | 256,08348% of peakModerate |
| May | 121,23762% of peakHigh | 383,09271% of peakHigh |
| June | 134,18269% of peakHigh | 507,61795% of peakPeak |
| July | 194,120100% of peakPeak | 535,577100% of peakPeak |
| August | 178,45192% of peakPeak | 537,020100% of peakPeak |
| September | 123,15263% of peakHigh | 472,98388% of peakPeak |
| October | 93,19548% of peakModerate | 412,60777% of peakHigh |
| November | 60,18831% of peakModerate | 216,34140% of peakModerate |
| December | 47,02624% of peakLow | 148,66128% of peakLow |
September averages 123,152 visits at Sequoia, 63% of its peak, and 472,983 at Yosemite, 88% of its peak. These totals describe seasonal visitation, not the crowd at a particular trail or overlook.
Park-wide recreation visits. A lower total does not establish lower crowd density.
| Measure | Sequoia | Yosemite |
|---|---|---|
| Recreation visits, 2025 | 1,378,337 | 4,278,413 |
| Average annual visits, 2021–2025 | 1,176,245 | 3,850,487 |
| Busiest month | July | August |
| Quietest month | February | January |
| Peak-to-quiet ratio | 4.8 to 1 | 4.7 to 1 |
| Months at 80%+ of peak | 2 | 4 |
Start with the area you want to see, then choose your entrance and overnight base.
General Sherman points you toward Sequoia. Yosemite Valley points you toward Yosemite. Check the approach to that area before choosing lodging.
Allow time for mountain-road travel and walks within each park. Map the entrances and stops rather than estimating from park names alone. Kings Canyon is a separate park, not part of the Sequoia count.
Choose Sequoia if General Sherman and Giant Forest are your main goals. Yosemite also protects giant sequoia groves. Choose Yosemite if you want to combine a grove visit with its granite-cliff and waterfall scenery.
For a first visit, give each park its own day so you have time for the sights and walks you came for. A transfer depends on the entrances and destinations you choose. Map those stops before booking.
No. They are neighboring national parks managed together. The Sequoia statistics on this page use the SEQU reporting unit and exclude Kings Canyon, even when an official planning page covers both parks.
The 2021–2025 monthly averages peak in July at Sequoia and August at Yosemite, with 194,120 and 537,020 average recreation visits. These are park-wide seasonal patterns. They do not measure the crowd at a particular stop.
An independent guide using official data. Not affiliated with or endorsed by the National Park Service.